Research Article - Modern Phytomorphology ( 2025) Volume 19, Issue 4
Molecular characterization of genetic diversity and mycorrhizal responsiveness in maize (Zea mays) cultivars using 18s rRNA, RBCL and ISSR markers
Amal Y. Aldhebiani1,2*, Amal T. K. Ashour1, Neveen S. Geweely3, Mohamed Abu-Zeid2, Givin J. Hosburgh4, Duncan D. Cameron5 and Salah E. M. Abo-Aba1,22Princess Dr Najla Bint Saudi Al-Saud for Excellence Research in Biotechnology, Jeddah, 21589, Saudi Arabia
3Department of Botany and Microbiology, Faculty of Science, Cairo University, Giza, 12613, Egypt
4Department of Animal and Plant Sciences, University of Sheffield, Sheffield, UK
5Department of Biotechnology, Manchester Institute of Biotechnology, University of Manchester, Manchester, UK
Amal Y. Aldhebiani, Department of Biological Sciences, Faculty of Science, King Abdulaziz University, Jeddah, 21589, Saudi Arabia, Email: aaldhebiani@kau.edu.sa
Received: 29-May-2025, Manuscript No. mp-25-166171; , Pre QC No. mp-25-166171 (PQ); Editor assigned: 02-Jun-2025, Pre QC No. mp-25-166171 (PQ); Reviewed: 16-Jun-2025, QC No. mp-25-166171; Revised: 07-Jul-2025, Manuscript No. mp-25-166171 (R); Published: 14-Jul-2025, DOI: 10.5281/zenodo.17346054
Abstract
Maize (Zea mays) is a globally significant crop, and its genetic diversity is crucial for its adaptation and improvement through breeding programs. This study employed molecular markers 18S rRNA, RBCL gene sequences, and Inter-Simple Sequence Repeats (ISSR) to assess the genetic diversity and mycorrhizal responsiveness of 18 maize cultivars cultivated in Saudi Arabia. Phylogenetic analysis using maximum likelihood methods revealed two major clades, with significant variation in mycorrhizal responsiveness among genetically similar cultivars. The results indicate that while genetic relatedness is a factor, it is not a strong predictor of mycorrhizal symbiosis. ISSR markers were particularly effective in revealing polymorphisms, with the cultivars displaying considerable genetic diversity, thus supporting their use in future marker-assisted selection and breeding programs. These findings provide valuable insights into the genetic structure of maize cultivars in Saudi Arabia and offer a foundation for enhancing crop traits, such as nutrient uptake and stress tolerance, particularly in arid environments. This study underscores the importance of molecular markers in elucidating phylogenetic relationships and advancing genetic improvement strategies in maize.
Keywords
Maiz, Molecular Markers, Genetic diversity, 18S RRNA, ISSR, RBCL
Introduction
Maize is an important crop worldwide; agricultural income and seed diversity have increased recently. There are several examples in the literature of the patterns of diversity and the variation in maize and its adaptation to local growing conditions, and farmers' choices affected regarding the conservation of seed diversity (Huang et al., 2016; Stromberg et al., 2010). The main source of seed is an important part of maize cultivation in any country; farmers obtain seeds from their local markets depending on their shape and some knowledge base, Selection depending on agronomic performance and the delivery of specific products and properties (Flint-Garcia et al., 2009; Pascual & Perrings, 2007). The flow of information, trust for seed sharing, and seed quality do not have sufficient information for most farmers. It always depends on looking at it, and they always use the seeds from the previous harvest and store them (Badstue et al., 2007). A variety of maize seeds’ appearance and diversity in local agro-biodiversity maintained increasingly in recent years depending on their quality parameters, such as oil content, sweetness, and degree of wax in seeds and its purity standards (Zhang et al., 2012). Little is known about the inter-species of maize and the seed diversity (Reyes-García et al., 2008). Large-scale sequencing studies comparing Teosinte (a progenitor of Z. mays) to modern inbred lines have indicated that 2–4% of the maize genome has experienced artificial selection throughout its history, i.e., during domestication and/or plant breeding (Wright et al., 2005; Yamasaki et al., 2005). Little or no genetic variation remains in inbred lines to contribute to crop improvement by traditional breeding or gene discovery by genetic analysis. Geneticists are just now beginning to understand domestication's consequences and crop species' breeding history (Hamblin et al., 2006; Hyten et al., 2006; Tang et al., 2006).
The applications of molecular markers in the breeding programs of different plant crops have significantly increased in the last few years. Molecular markers not only facilitated the production of novel varieties but also strengthened the identification of disease-resistance genes and their related molecular marks by reducing the time needed to discover unique properties in progeny plants (Debasis & and Paramjit, 2001). In addition, molecular markers are helpful tools for building a genetic map (Qi et al., 2004), determine genetic diversity within the natural population (Abdel-Mawgood et al., 2005), establish evolutionary and taxonomic links (Crozier, 1997; Schaal et al., 1998), develop markers related to resistance to diseases (Bachman et al., 2001; Dubcovsky, 2004; Zhao et al., 1997), DNA fingerprints and registry cultivars and develop species-specific markers (Abdel-Mawgood et al., 2005; Camlin, 2003; Rao, 2004). There is a rising tendency to produce hybrid maize, which offers higher yields, broad adaptability, and performance and quality reliability. However, these hybrids' genetic purity must be specific (Abdel-Mawgood et al., 2005). different molecular markers such as the 18S rRNA, RBCL gene and ISSR represent a newer and more reliable approach based on the phylogenetic positions of many plant species.
18S ribosomal RNA is commonly utilized in gene expression investigations such as End-PCR, Northern blotting and quantitative real-time PCRs as the internal control gene for normalization. One advantage of employing 18S rRNA is its low turnover rate, and the large 18S rRNA pool is less prone to significant alterations from physiological perturbations. Numerous studies have verified its use by demonstrating its invariant expression across multiple species, tissues, developmental stages, and treatments (Bustin, 2000; Chen et al., 2012; Goidin et al., 2001; Jarošová & Kundu, 2010; Maroufi et al., 2010; Nicot et al., 2005). however, there are certain disadvantages to utilizing 18S rRNA as a reference gene. For example, because 18S rRNA is far more abundant than any other mRNA transcript, it must be diluted to attain a threshold value within the dynamic range of real-time PCR devices, introducing unpredictability into the result (Bogdanovi, et al., 2013).
The RBCL gene, which encodes the large subunit of ribulose 1,5-bisphosphate carboxylase/oxygenase (RuBisCO), has been widely sequenced from a variety of plant taxa, and the accompanying data set has tremendously assisted studies of plant phylogeny (Palmer et al., 1988). Parson et al. (2000) clarified that the RBCL gene can be recognized by genus and family level.
Bioinformatical analysis technologies have also provided a more comprehensive analysis of genetic diversity and the Molecular characterization of genetic diversity and … |230 genetic sequence analysis of species populations (Roy et al., 2010). The RBCL gene is part of the DNA sequence located in cpDNA and can be used as a barcode for DNA because of its universality and ease of amplification and analysis in this coding region (Hasebe et al., 1994; Les et al., 1991; Newmaster et al., 2006). Based on the study of (Hollingsworth et al., 2009), the plant species could be observed because this gene RBCL is easily amplified and sequenced and has several phylogenetic characteristics because it is about 1400 bp in total length. Compared to other codes in cpDNA, this sequence is low in mutation because the similarity between species is high (Kellogg & Juliano, 1997). The plastid genome is acquired uniparentally, unrecombined and structurally stable, and the rival gene of the plant DNA barcode is the most promising (Hebert et al., 2003). The RuBisCO large subunit (RBCL) plastic marker was commonly used to investigate the unknown taxonomic position of species to elucidate taxonomic linkage among species (Hollingsworth et al., 2011).
Molecular markers facilities by ISSR DNA markers in plants, which involve amplification of DNA segments present at an amplifiable distance in between two identical microsatellite repeat regions oriented in opposite directions, have many advantages in plant genetic analysis because they are simple, widely used techniques highly polymorphic more in number, stable across different developmental stages, neutral to selection and least influenced by environmental factors (Vijayan, 2005). ISSR markers are highly polymorphic and valuable in genetic diversity, phylogeny, gene tagging, genome mapping, and evolutionary biology research (Pradeep Reddy et al., 2002). ISSR-PCR amplified sequences can be utilized for DNA fingerprinting. ISSR primers might occasionally be less specific to the scanned genome, resulting in more apparent fingerprints. Poor reproducibility of ISSR results is also caused by poor-quality genomic DNA (Sarwat, 2012).
Previous efforts to develop molecular markers in Zea mays based on ISSR (Idris et al., 2012; Jana et al., 2013; Osipova et al., 2003) techniques are well documented. These markers are helpful in cultivar identification and in studying genomic diversity and evolution. Different specific markers in crop plants were also successfully detected based on ISSR approaches (Edris et al., 2014; Sabir et al., 2014a). These markers can be utilized in marker-assisted selection and breeding programs in Zea mays. Little is known about the origin of Zea mays germplasm grown in Saudi Arabia.
This study aimed to explore the usefulness of the two genes (18s and RBCL) and ISSR markers, assessing relatedness among eighteen different maize samples and characterisation of cultivar-specific markers to identify the genetically variable genotypes to be utilized in the future breeding program in Saudi Arabia to develop promising genetic materials with improved maize crop characteristics, particularly for plant mycorrhizal responsiveness. This will be achieved using the molecular marker (18S, RBCL and ISSR analysis)
Our hypothesis is based on the following: There will be a genetic similarity between the 18 Zea mays cultivars, and the mycorrhizal responsiveness will be related to this genetic similarity between the plant cultivars and the breeding program will affect this relationship between the genetic similarity and the mycorrhizal responsiveness, so we hypothesis 2 main points:
- The variability within mycorrhizal positively responsive clades and neutral clades will be smaller than thevariability between those clades.
- The negatively mycorrhizal responsiveness cultivars will be genetically different from all other cultivars.
Materials and Methods
Seeds collection
Eighteen different varieties of maize seed samples were collected from several different companies from the Kingdom of Saudi Arabia (samples from 1-9 from Al-kanahil Agricultural EST, samples from 10-19 from Saudi United Fertilizer Co. and samples from17-18 from Twaiq Agricultural Co.) and the companies itself sterilized the seeds from fungicides to keep it’s without pollution. 18 different varieties of maize seeds that have distinct characteristics were classified depending on their shape and colour, as shown in Fig 1.
Seed preparation and seedling
Seeds were washed with sterile distilled water to remove any fungicide debris. Each type of seed was planted in one spot containing sterile soil with some perlite, with five replicates. The duration of planting was 60 days, watered every three days.
Genomic DNA extraction and purification
We have 18 samples for 18 varieties, but the cultivars no. 13,15 did not grow. 100 mg fresh frozen shoot tissue was weighed for each sample and grounded in a mortar with liquid nitrogen. Pipette 350 μL of lysis buffer A into a 1.5 mL microcentrifuge tube, then transfer the ground tissue to the lysis buffer A and vortex for 1 min; add 50 μL of lysis buffer B and 20 μL RNase A and vortex for 1 min, the sample was incubated at 65°C for 10 min, 130 μL of precipitation solution was added and mixed by inverting the tube 2-3 times and incubated 5 min on ice, then the sample was centrifuged for 5 min at 14,000 rpm, the supernatant (usually 450-550 μL) was collected and transferred to the clean microcentrifuge tube and 400 μL of plant gDNA binding solution then 400 μL of 96% ethanol were added and mixed well, half of the prepared mixture (600-700 μL) was transferred to the spin column. The flowthrough solution was discarded after centrifuging for 1 min at 8,000 rpm. The remaining mixture was applied onto the same column and centrifuged for 1 min at 8,000 rpm, 500 μL of wash buffer I was added to the and centrifuged for 1 min at 10,000 rpm. The flow through was discarded and placed the column back into the collection tube; 500 μL of Wash Buffer II was added to the column and centrifuged for 3 min at a maximum speed of 14,000 rpm, then the collection tube was emptied, the purification column was placed back into the tube and re-spun the column for 1 min. At maximum speed ≥ 14,000 rpm, it was kept open in the incubator at 37°C for 10 minutes for ethanol to evaporate. Then, the collection tube containing the flow-through solution was discarded and transferred the column to a sterile 1.5 mL microcentrifuge tube, 100 μL of elution buffer was added to the centre of the column membrane and incubated for 5 min at room temperature and centrifuge for 1 min at 10,000 rpm, and the purified DNA was ready to use. Using a spectrophotometer, the DNA concentration in different samples was estimated by measuring optical density at 260 nm and 280 nm. The quality of extracted DNA was assessed by running on 1.5 % agarose gel electrophoresis, using ethidium bromide (5 μg/ml) in 1X Tris-acetate Edita (TAE) buffer we prepared the buffer by adding 18.612 gm of Na-EDTA and 242.2 gm Tris-HCl (pH 8) and 57.1 ml acetic acid and H2O (d.w) Up to 100 ml. Agarose was placed in 1X TAE buffer and boiled in a water bath; then ethidium bromide was added to the melted gel after the temperature became 55°C. The melted gel was poured into the tray of mini-gel apparatus, and the comb was inserted immediately then the comb was removed when the gel was hardened. The electrophoresis buffer (1X TAE) was then covered in the gel. 10 μl of dsDNA was loaded in each well and 5 μl of 1Kb DNA ladder from gold biotechnology and was run at 95 volts. Gel images were visualized using a UV transilluminator and photographed using a gel documentation system (BIO-RAD 2000, USA). GeneJET plant genomic DNA purification kit was used for the purification of amplified PCR using a 1Kb DNA Ladder according to (George et al., 2004) with some modifications (Azcárate-Peril & Raya, 2001).
Detection of PCR products for 18S and RBCL
The data in Tab. 1 showed 18S gene the PCR the reaction mixture 25 μ consisted of 1 μL of each primer (forward and reverse), one μ of the sample, 12.5 μL master mix which contained (15 mM MgCl2, 1× buffer (Promega), 0.2 mM dNTPs, one μL of Taq DNA polymerase (GoTaq, Promega)), and 9.5 dH2O to a volume of 25 μL. PCR amplification was performed in 40 cycles (94°C for 5 mins, 94°C for 45 sec, 56.4°C for 1 min, 72°C for 2 mins, 72°C for 10 mins and 10°C for ∞). The amplification products were determined by electrophoresis in a 1.5% agarose gel. Using ethidium bromide (0.5 μg/ml) in 1X Tris-acetate Edita (TAE) buffer at 95 volts. A marker CSL-MDNA-100BP DNA ladder RTU (cleaver scientific) was used as a molecular size standard for PCR product size determination. Gel images were visualized using a UV transilluminator and photographed using a gel documentation system (BIO-RAD 2000, USA). GeneJET PCR purification kit (Catalog number: K0701) was used to purify amplified PCR-products using the manufacturer’s manual. The extracted PCR products have been incubated for 2 min at ambient temperature or at −20°C when stored. Macrogen Inc., Korea, used Sanger DNA sequencing tech. to perform the RBCL PCR products DNA sequencing (Romero et al., 2021; Taerum et al., 2020).
| oligo | 18S_F1_(20b) _Forward | ||||
|---|---|---|---|---|---|
| SEQ | (5′-CAA CCA TAA ACG ATG CCG AC-3′) (20mer) | ||||
| GC% | 50 | Tm(c) | 58.4 | Vol for 100 pmol/ul | 416 |
| oligo | 18S_R1_(20b) _Reverse | ||||
| SEQ | (5′-TTT CAG CCT TGC GAC CAT AC-3′) (20 mer) | ||||
| GC% | 50 | Tm(c) | 58.4 | Vol for 100 pmol/ul | 411 |
Table 1. Presented the forward and reverse primers for 18S PCR.
For RBCL gene in Tab. 2 revealed the PCR the reaction mixture 25 μL consisted of 1 μL of each primer (forward and reverse), 1 μ of the sample, 12.5 μ master mix which contain (15 mM MgCl2, 1× buffer (Promega), 0.2 mM dNTPs, 1 μL of Taq DNA polymerase (GoTaq, Promega), and 9.5 dH2O.to a volume of 25 μL. PCR amplification was performed in 40 cycles (94°C for 5 mins, 94°C for 45 sec, 63°C for 1 min, 72°C for 2 mins,72°C for 10 mins and 10°C for ∞). The amplification products were determined by electrophoresis in a 1.5% agarose gel using ethidium bromide (0.5 μg/ml) in 1X Tris-Acetate Edita (TAE) buffer at 95 volts. A marker CSL-MDNA-100BP DNA ladder RTU (cleaver scientific) was used as a molecular size standard for PCR product size determination. Gel images were visualized using a UV transilluminator and photographed using a Gel Documentation System (BIO-RAD 2000, USA). GeneJET PCR Purification Kit (Catalog number: K0701) was used to purify amplified PCR products using the manufacturer’s manual. The extracted PCR products have been incubated for 2 min at ambient temperature or at -20°C when stored. Macrogen Inc., Korea, used Sanger DNA sequencing tech to perform the RBCL PCR products DNA sequencing (Khan et al., 2020).
| oligo | RBCL_F1_(21b) _Forward | ||||
|---|---|---|---|---|---|
| SEQ | (5′-ACT CCT CAG CTC GGG GTT CCG-3′) (21 mer) | ||||
| GC% | 66.67 | Tm(c) | 67.2 | Vol for 100pmol/ul | 449 |
| oligo | RBCL_R1_(20b) _Reverse | ||||
| SEQ | 5′-TCC CCA GGA ACG GGC TCG AT-3′) (20 mer) | ||||
| GC% | 65 | Tm(c) | 64.6 | Vol for 100 pmol/ul | 439 |
Table 2. Presented the forward and reverse primers for RBCL PCR.
DNA was purified from the PCR mixture using the QIAquick gel extraction kit (Qiagen GmbH, Germany) according to the manufacturer’s instructions. First, we Excised the DNA fragment from the agarose gel with a clean, sharp scalpel, then we Weighed the gel slice in a colorless tube three volumes Buffer QG to 1 volume gel (100 mg gel ~100 μL) was added, and the maximum amount of gel per spin column is 400 mg. Incubated at 50°Ch for 10 min (or until the gel slice has completely dissolved). Vortex the tube every 2-3 min to help dissolve gel. After the gel slice had dissolved completely, we checked that the color of the mixture was yellow (similar to Buffer QG without dissolved agarose). After the color of the mixture is orange or violet, 10 μl 3 M sodium acetate was added. pH 5.0, and mixed. The mixture turns yellow. Then 1 gel volume isopropanol was added to the sample and mixed. A QIAquick spin column was placed in a provided 2 ml collection tube. To bind DNA, the sample was applied to the QIAquick column and centrifuged for 1 minute, and all the samples passed through the column. Flow was discarded, and the QIAquick column was placed back into the same tube. If DNA is subsequently used for sequencing, in vitro transcription, or microinjection, 500 μl buffer QG will be added to the QIAquick column and centrifuged for 1 min. Flow discarded through and placed the QIAquick column back into the same tube. To wash, 750 μl buffer PE was added to the QIAquick column and centrifuged for 1 min. The flow was discarded, and the QIAquick column was put back into the same tube. Then, the QIAquick column was placed into a clean 1.5 ml microcentrifuge tube. To elute DNA, 50 μL buffer EB (10 mM TrisØCl, pH 8.5) was added or water to the center of the QIAquick membrane and centrifuged the column for 1 min. For increased DNA concentration, 30 μl buffer EB was added to the center of the QIAquick membrane, kept for 1 min. Then centrifuged for 1 min. After adding Buffer EB to the QIAquick membrane, the incubation time increased to 4 min. If purified DNA is to be analyzed on a gel, we added 1 volume of Loading Dye to 5 volumes of purified DNA. Mixed the solution by pipetting up and down before loading the gel (Zhou et al., 2018).
Analysis of 18S and RBCL
Alignment of the 18 cultivars for 18S and RBCL sequences was carried out using version 2 of Clustalx (Larkin et al., 2007). Exploratory data and phylogenetic analyses were conducted under R Project for statistical computing (R Core Team., 2021). Exploratory data analysis was done using Seqinr (Charif & Lobry, 2007) R package. The ape package carried out phylogenetic analysis (Paradis et al., 2004). Reconstruction of the phylogenetic tree was done using maximum likelihood inference of the phylogenetic tree (Goldman N., 1990).
Sequencing of 18S and RBCL
PCR amplification and sequencing of 18S rRNA gene and RBCL isolated gene analysis were done. The amplified PCR products of the 18S rRNA gene fragments and isolated from each cultivar were detected by electrophoresis in 1.5% agarose gel.
The amplified fragments from 18S rRNA, gene and RBCL gene were purified and sequenced at MACROGEN sequencing company, Seoul, Korea using the automated sequencer ABI 3100 (Applied Biosystems) with Big Dye Terminator Kit v. 3.1 (Applied Biosystems). The sequences obtained were edited with Vector NTI Suite 9 software and compared with the NCBI database through BLAST searches. In this comparison, sequences of type cultivars most closely related to the sequences of the isolates were searched. For the definition of Operational Taxonomic Units (OTUs), a similarity limit of 97% was adopted.
Detection of PCR products for Inter-simple sequence repeat (ISSR)
Five primers were utilized for ISSR analyses Tab. 3 PCR was performed, according to (Karapetsi et al., 2021). The PCR reaction mixture 25 μL consisted of 1 μL of each primer (forward and reverse), 1 μL of the sample, 12.5 μL master mix, which contained (15 mM MgCl2, 1× buffer (Promega), 0.2 mM dNTPs, 1 μL of Taq DNA polymerase (GoTaq, Promega)), and 10.5 dH2O.to a volume of 25 μL. PCR amplification was performed in cycles (94°C for 5 mins, 94°C for 1 min, 42°C for 1.5 min, 72°C for 2 mins, 72°C for 10 mins and 10 °C for ∞). The amplification products were determined by electrophoresis in a 1.5% agarose gel using ethidium bromide (0.5 μg/ml) in 1X Tris-Acetate Edita (TAE) buffer at 95 volts. For PCR product size determination, a marker CSL-MDNA-100BP DNA ladder RTU (cleaver scientific) was used as a molecular size standard. Gel images were visualized using a UV transilluminator and photographed using a Gel Documentation System (BIO-RAD 2000, USA).
| Primer no. | Primers | Sequences |
|---|---|---|
| 1 | 17898A | CAC ACA CAC ACA AC |
| 2 | 17898B | CAC ACA CAC ACA GT |
| 3 | 17899A | CAC ACA CAC ACA AG |
| 4 | 17899B | CAC ACA CAC ACA GG |
| 5 | 844B | CTC TCT CTC TCT CTC TGC |
Table 3. List of used primers, their nucleotide sequences, total number of produced bands.
Analysis of ISSR products
ISSR products were visualized using agarose gel electrophoresis (1.5% in 1x TAE buffer) and staining with ethidium bromide (0.3 ug/ml). Amplicons were visually examined with a UV transilluminator and photographed using a CCD camera (UVP, UK). Data scored as (1) for the presence and (0) for the absence of a given fragment, and sizes were estimated by comparison with a 100 bp ladder (Promega, USA), using gel works 1D advanced gel documentation system (UVP, UK). Binary data matrices were entered into TFPGA (version 1.3) and analyzed using a qualitative routine to generate a similarity coefficient. Dissimilarity coefficients were used to construct dendrograms using an unweighted pair group method with arithmetic average (UPGMA) and sequential hierarchical and nested clustering (Neighbor-Joining or NJ) routine using NTSYSpc (version 2.10, Exeter software) according to (Burgos et al., 2011; Rohlf, 1997; Sabir et al., 2014b; Sneath, 1973).
Results and Discussion
Seeds morphology
Regarding collective action and seed diversity, the results suggested that, as shown in Fig. 1, it could distinguish all varieties of maize seeds by shape and colour variance. These features help to discriminate a variety of collected maize seeds. Fig. 1 shows the variation of 18 varieties of collective maize seeds. It could be seen that the colour is almost yellow. The red colour is due to antifungal treatment from its local market. All varieties showed different shapes. Based on shape, we conclude that the collective seeds are different. The importance of its shape in seed systems is essential for maintaining seed diversity, and hence a precondition for agrobiodiversity conservation, for this to be at the national level in some countries to restrict local seed system exchanges (Nature, 2004). However, the legal rights of farmers to save and exchange their local seeds are an essential issue if agrobiodiversity conservation is deemed necessary. Policymakers should, therefore, encourage farmers to engage in a relatively open exchange of seeds rather than aiming to restrict such flows.
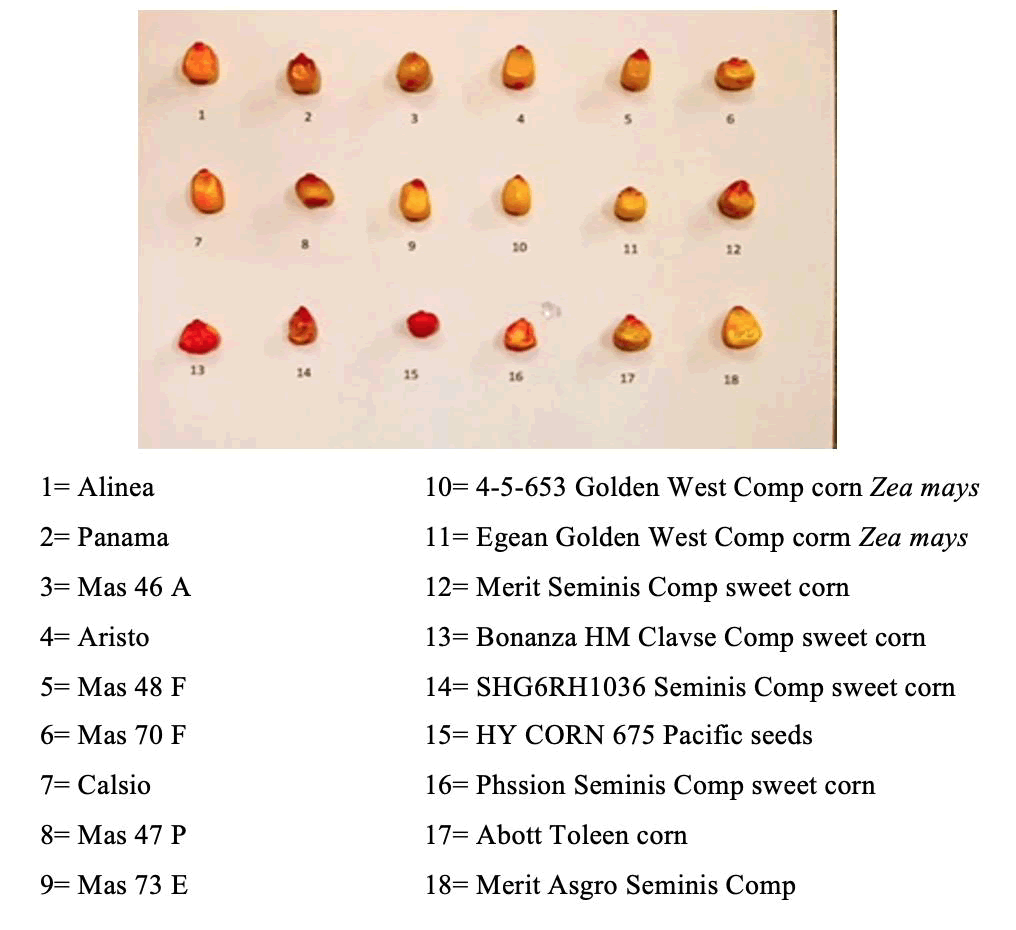
Figure 1. Diversity image in 18 used varieties of maize seeds and its commercial named.
Genomic DNA extraction and purification
The genomic DNA extraction was successfully performed, and the agarose gel electrophoresis was run. The results are clearly shown in Fig. 2. The Agarose gel electrophoresis of 18S rRNA of 18 Zea mays cultivars was successfully performed, and perfect results were obtained, as shown in Fig. 3. The sequence length of the 18S for 18 Zea mays varieties averaged 93 pairs. The sequence length from 86 to 98 bases, with no outliers’ values, was noticed in Fig. 4a. The GC content is shown in Fig 4b. The percentage of the GC content averaged 53%, ranging from 52% to 55%. However, only one outlier value was noticed.
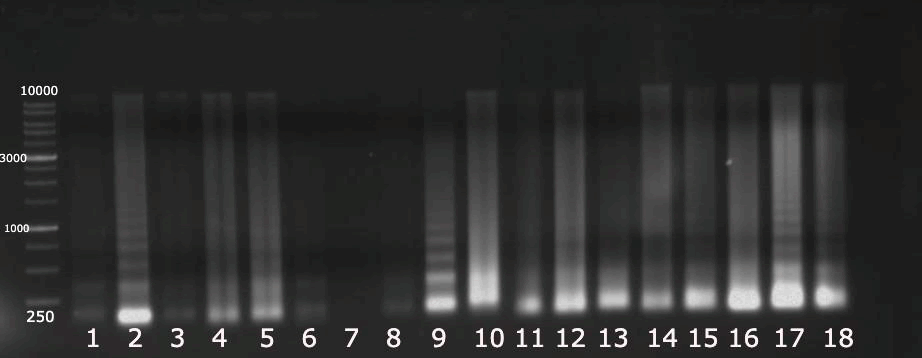
Figure 2. Agarose gel electrophoresis of genomic DNA extraction of 18 Zea mays cultivars.
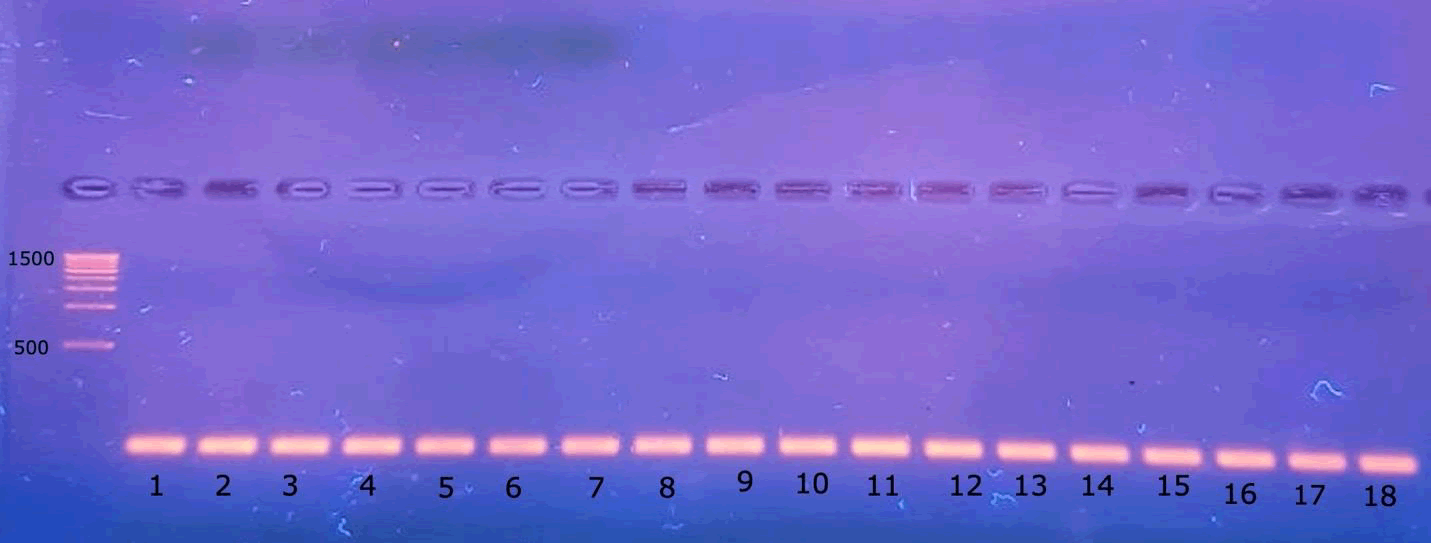
Figure 3. Agarose gel electrophoresis of 18S rRNA of 18 Zea mays cultivars.
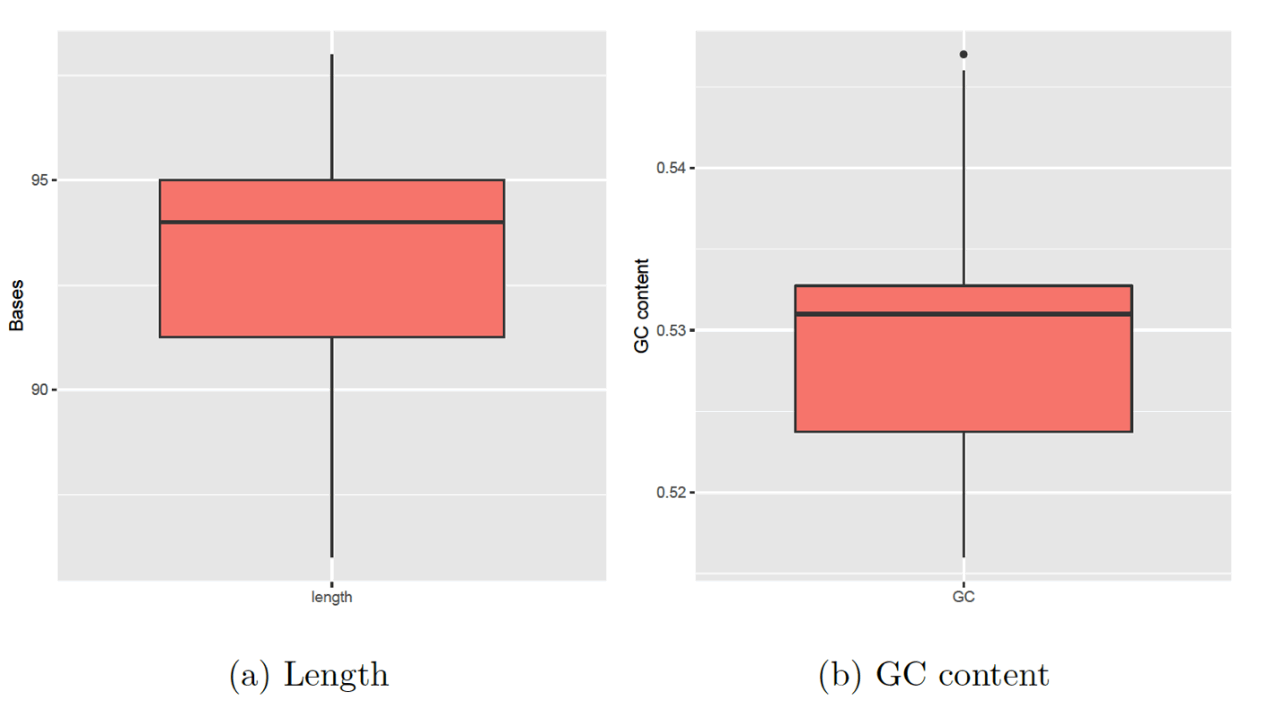
Figure 4. Boxplot for sequence length and GC content of 18S for 18 Zea mays varieties sequences, where the top and bottom of lines represent the maximum and minimum values, the top and bottom of each box represent the first quartile (Q1) and third quartile (Q3) where the line inside each box is the median (Second quartile Q2), dots above and below are outlier values.
Fig. 5 shows the base frequencies of the 18S for 18 Zea mays varieties; no significant differences could be noticed. The maximum likelihood phylogenetic tree of the 18S for the 18 Zea mays varieties, along with the heat map, is depicted in Fig. 6. The phylogenetic tree consists of two large clades. One clade, the lowest one, comprised seven cultivars distributed in many clusters, whereas the upper clade also comprised 11 cultivars distributed in many clusters.
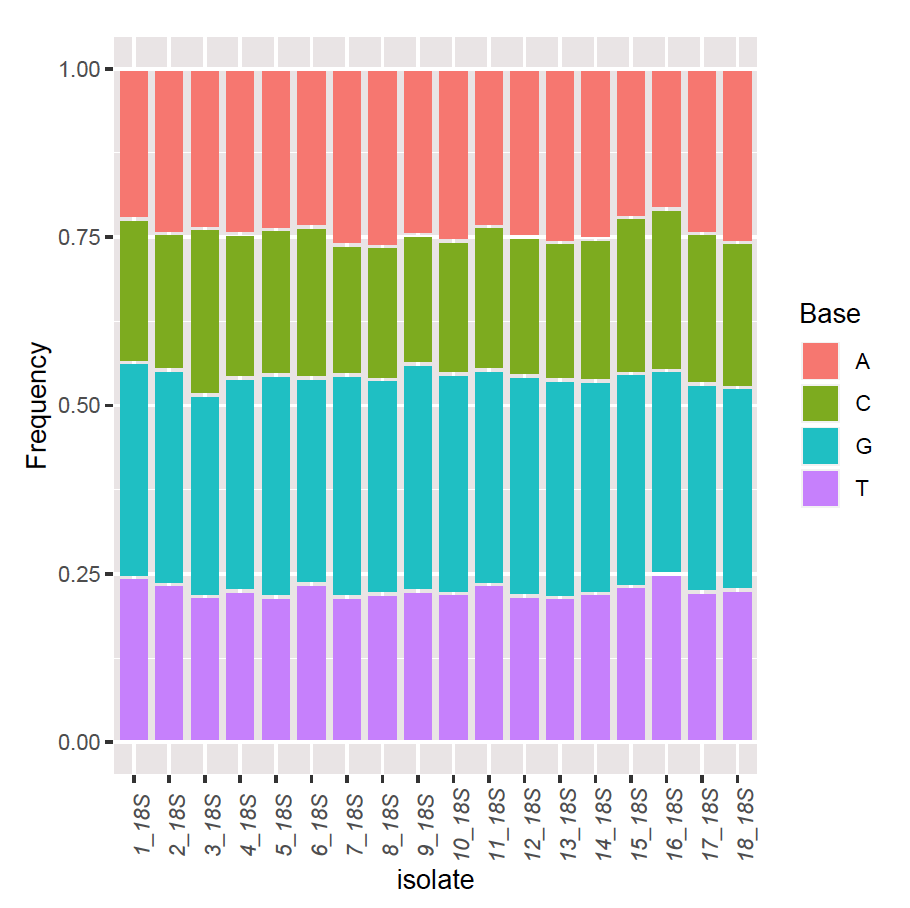
Figure 5. Base frequencies of 18S for 18 Zea mays varieties.
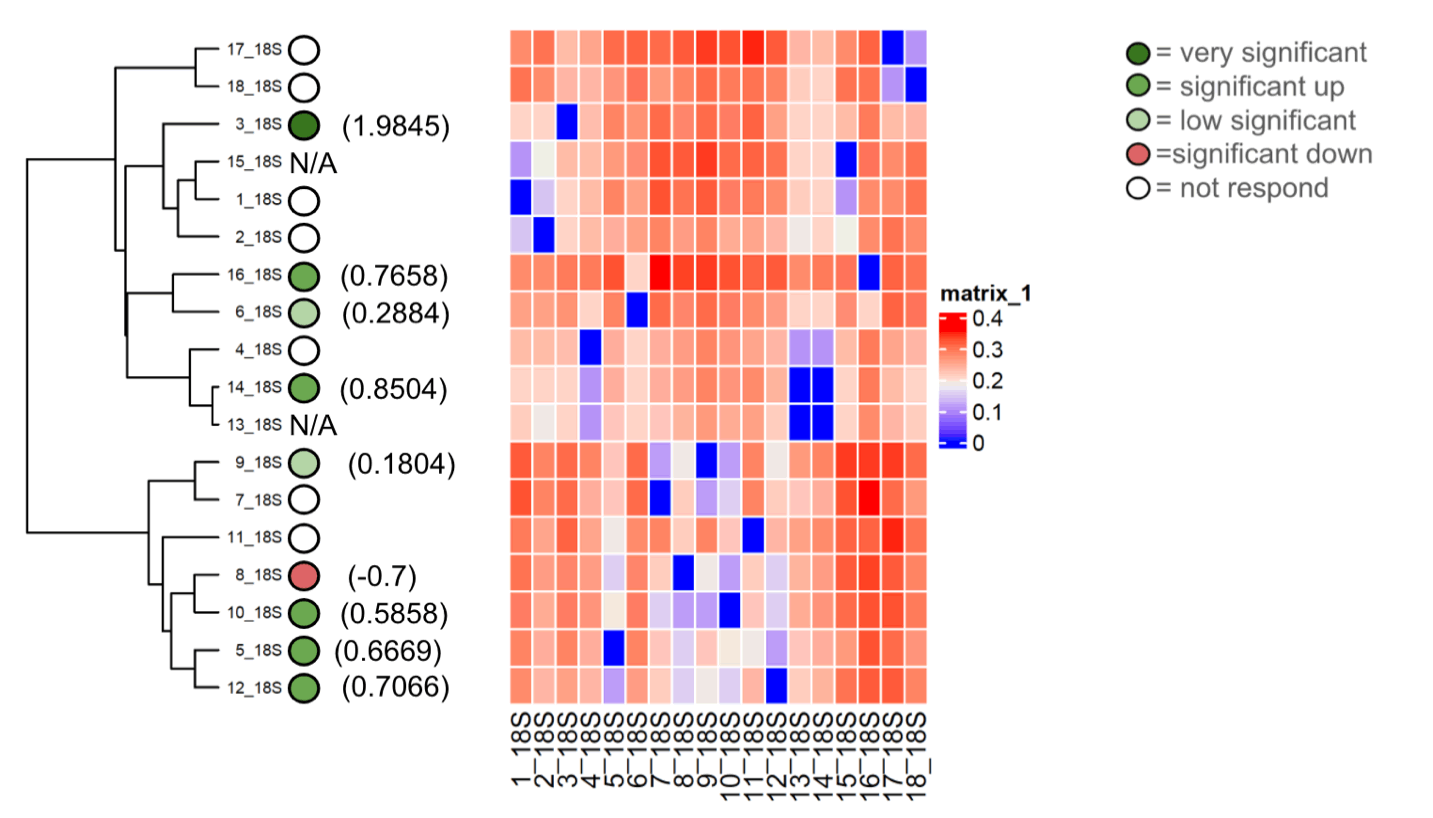
Figure 6. Maximum likelihood method phylogenetic tree of 18S for 18 Zea mays varieties along with heat map.
We concluded from the tree that genetics can play a role in influencing mycorrhizal responsiveness, but it is only consistent for some varieties. So, that means there was not a strong selection with the breeding program. But this analysis also proved that our cultivars were pure without contamination as the bands appeared quite clearly when the gel electrophoresis was done, which strongly indicates that all cultivars were pure Zea mays. The phylogenetic tree consists of two large clades. The upper clade comprised 11 varieties. Cultivars no. 17 and 18 were related to each other in the genetic relationship and had no responsiveness. Correspondingly, the cultivars no. 16 and 6 had the same results. The rest of the cultivars were different in terms of genetic relationships and responsiveness. The lower clade showed a correlation between the genetic relationship and the mycorrhizal responsiveness in cultivars no. 5 and 12, where the responsiveness was significantly high. The exciting result appeared in cultivars no. 8 and 10, where the genetic origin was similar, but the responsiveness differed.
RBCL phylogeny relationship
The Agarose gel electrophoresis of RBCL of 18 Zea mays cultivars was successfully performed, and perfect results were obtained, as shown in Fig. 7. The sequence length of the 18 RBLC sequences averaged 107 bases from 100 to 111 bases. Fig. 8a shows the presence of an outlier of 100 bases. Fig. 8b shows the GC content of the 18 RBLC sequences. The percentage of GC content averaged 48%, ranging from 45 to 50%. Again, outlier values are noticed in GC content. The phylogenetic tree consists of two large clades. Each clade comprised nine varieties. However, the upper clade consists of two clusters. It is also noticeable that the lower clade has no branches at all; the lower clade, which contains genetically closely related varieties no. 2, 15, 7, 16, 12, 10, 9, 5 and 8 showed a discrepancy in the mycorrhizal responsiveness, whereases most of them responded, and few did not. It was clear that no. 8 was negatively responsive, with an average (of- 0.7).
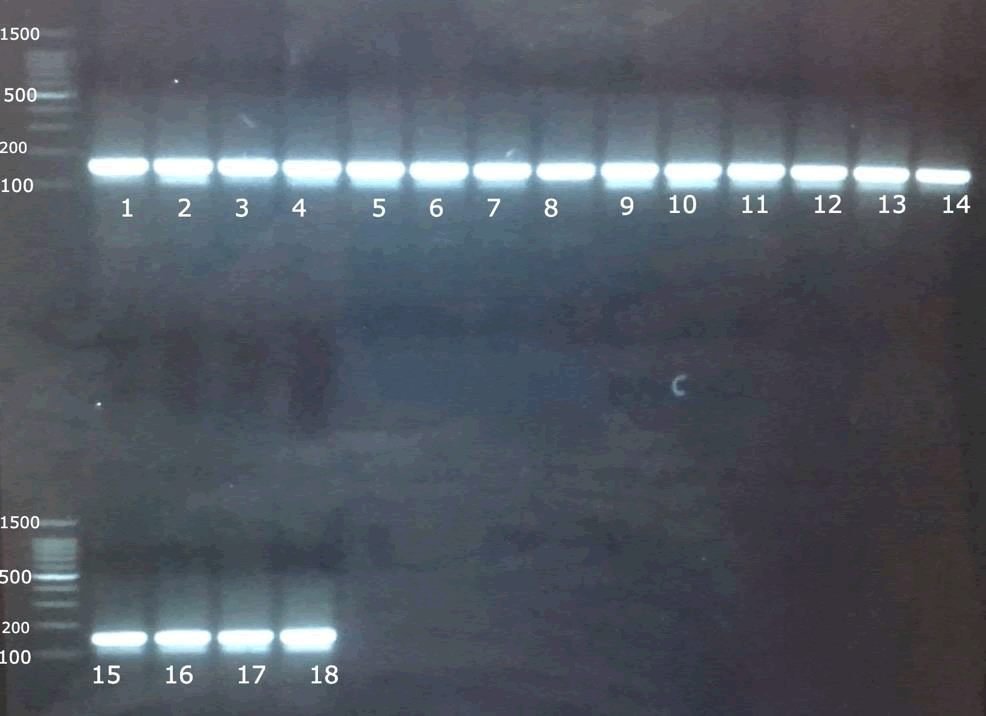
Figure 7. Agarose gel electrophoresis of RBCL for 18 Zea mays varieties.
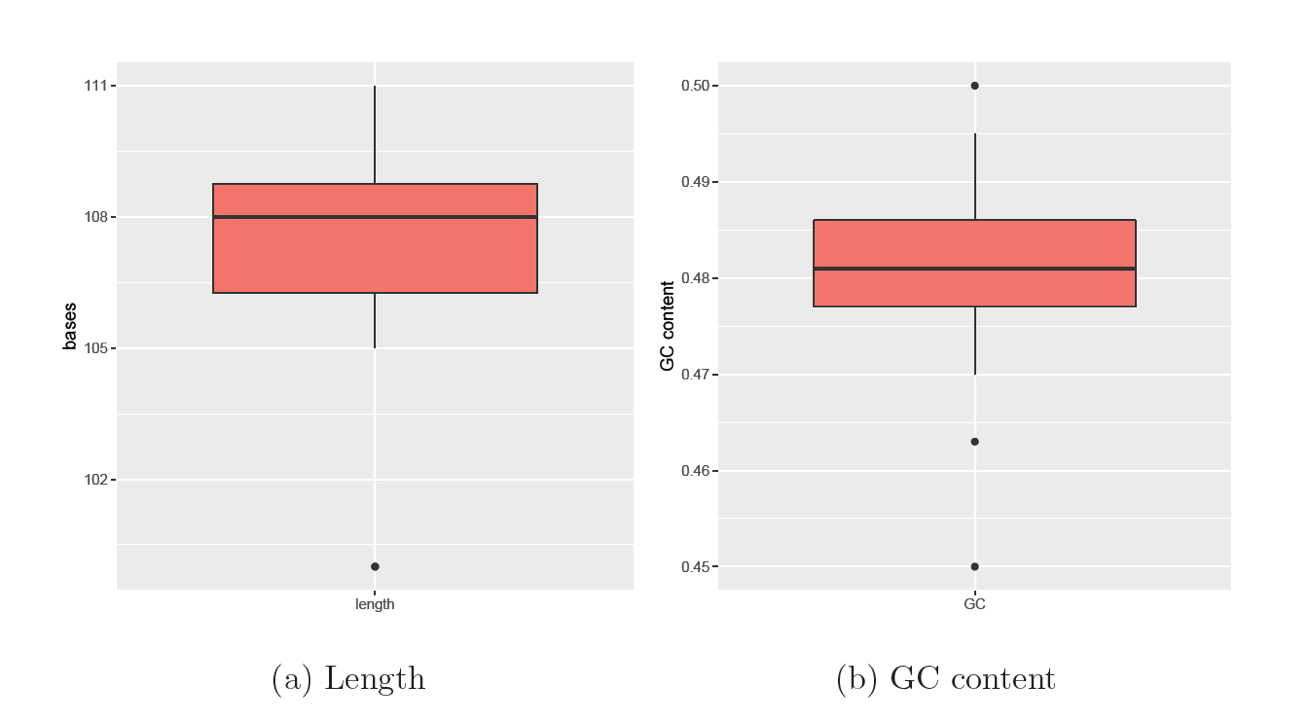
Figure 8. Boxplot for sequence length and GC content of 18 RBCL sequences, where the top and bottom of lines represent the maximum and minimum values, the top and bottom of each box represent the first quartile (Q1) and third quartile (Q3) where the line inside each box is the median (second quartile Q2), dots above and below are outlier values.
The upper clade, which included varieties no. 14, 3 ,4, 17, 6, 1, 11, 13 and 18, presented different mycorrhizal responsiveness, where most of them did not respond, and only three responded in various ways. Number 3 was the most responsive at all, with an average of (1.9845), which is indicative of an even closer evolutionary relationship among members of this clade. Fig. 9 shows the base frequencies of RBCL for 18 Zea mays varieties. No noticeable difference was in base frequencies. Fig. 10 shows the maximum likelihood phylogenetic tree of RBCL for 18 Zea mays varieties, along with a heat map. The phylogenetic tree generally has short branches, reflecting a very close evolutionary relationship among all the RBCL for 18 Zea mays varieties.
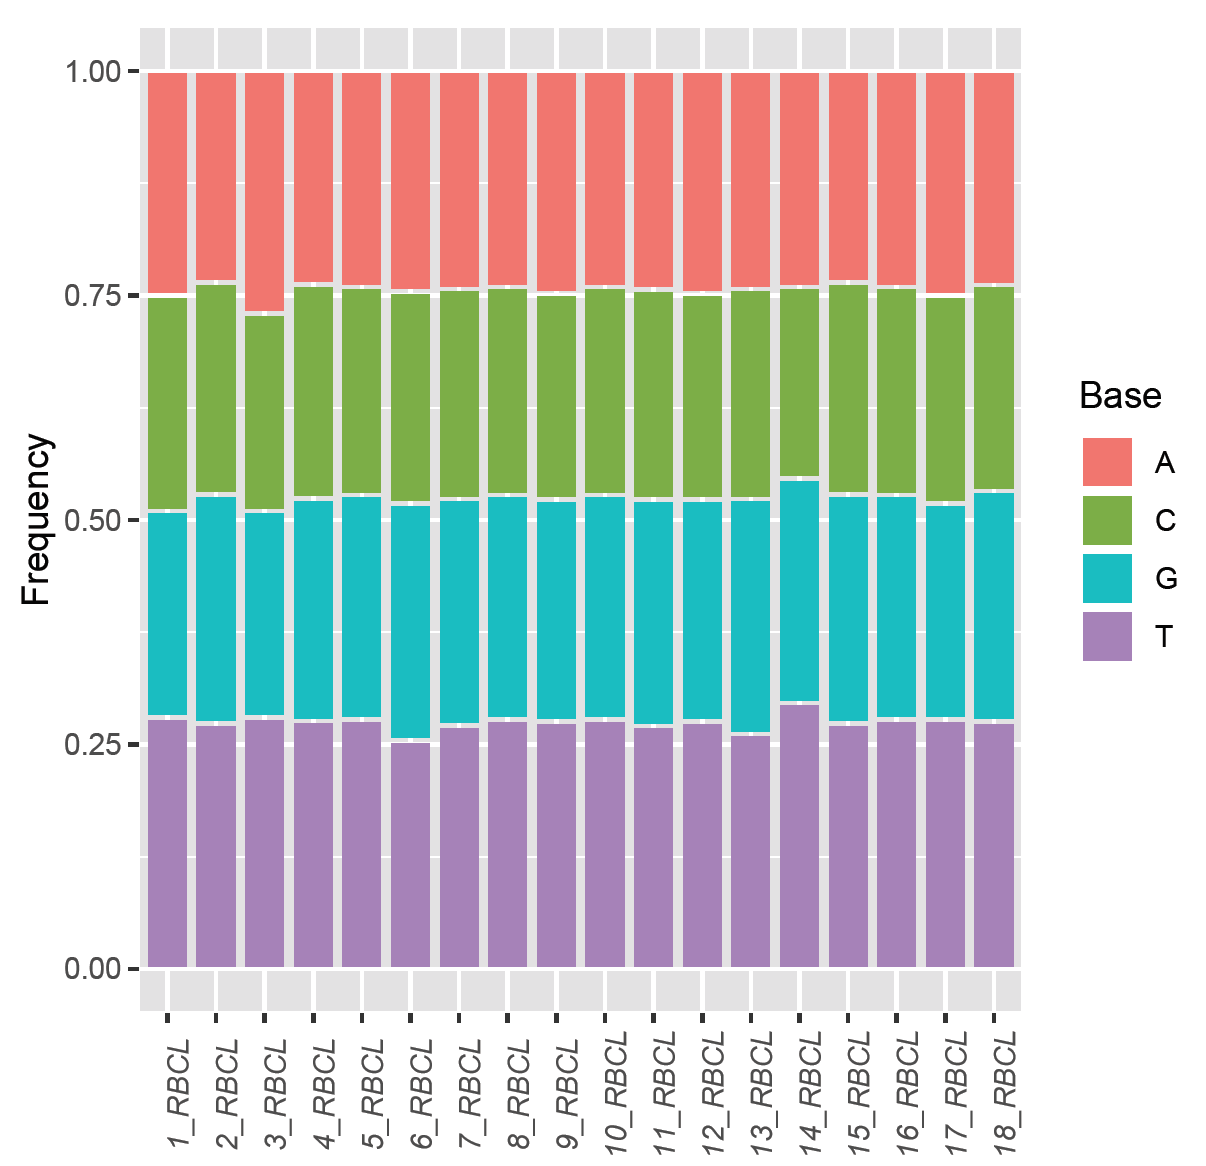
Figure 9. Base frequencies of RBCL for 18 Zea mays varieties.
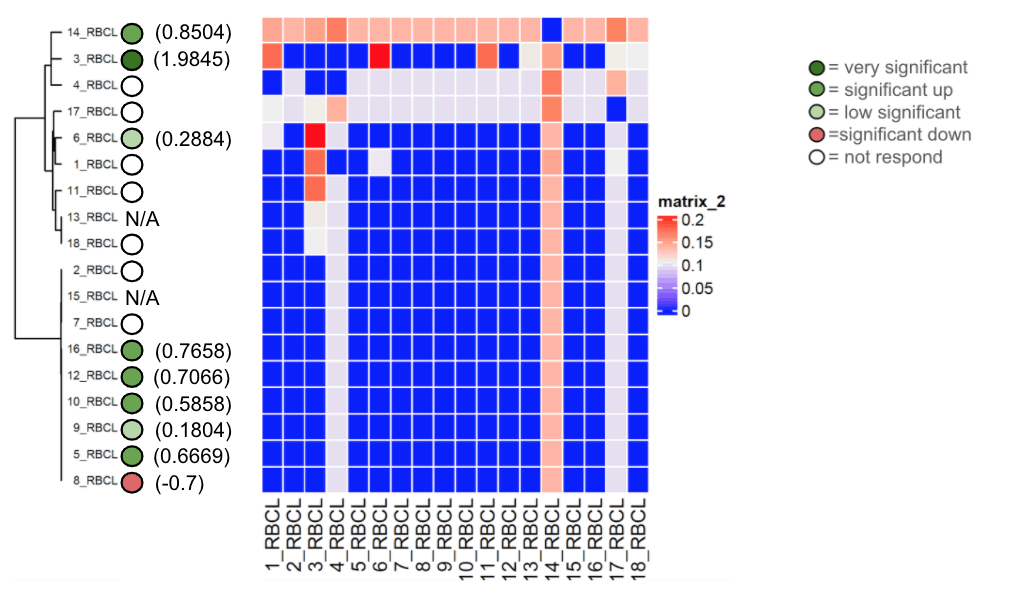
Figure 10. Maximum likelihood method phylogenetic tree of RBCL for 18 Zea mays varieties along with heat map.
The RBCL present in maize and our results using this gene showed that the genetic origin was very close to these cultivars in almost the first clade, and the other clade also showed affinity but not to the same degree of convergence in the first clade. We concluded from this tree that the response varies by genetic type according to the evolutionary relationship. For example, varieties from the same clade were considered similar and genetically close. Still, in terms of response, it varied between significant responsive, non-responsive, and low significant responsive, and what is exciting and surprising here is cultivar no. 8, where it was negative response despite the response of most of the varieties in the same clade, and this may be due to the breeding programs that affect some traits in plants, including the trait of responding to form colonization with the AMF or perhaps there were exceptional circumstances in terms of storage or cultivating this cultivar. That proved that the colonization was not affected by the genetic origin of the plant.
Molecular approaches based on DNA sequencing technology have been effectively established for exploring the phylogenetic relationships and classifications of unknown species of living organisms. A molecular technique using RBCL sequencing can be used to identify the phylogenetic and systematic analysis of Zea mays. We demonstrated that species-level identification is possible, and RBCL analysis yields a phylogenetic tree for these Zea mays cultivars (Wongsawad & Peerapornpisal, 2014).
ISSR fingerprint phylogeny relationship
The agarose gel electrophoresis of the five primers of ISSR of the 18 Zea mays cultivars and the phylogenetic trees were presented in (Fig. 11-20). The agarose gel electrophoresis was successfully performed, and the results were precise. In primer one (Fig. 11, 12), the results showed that the most closely related cultivars were no. (2,3) and (17,18), then (4,6), (9,10), (5,12), (8,14), (15,17). And we observed that (17,18) were similar in that there was no mycorrhizal responsiveness effect. While (5,12) were similar in the mycorrhizal responsiveness significant effect. However, despite their closeness, (8,14) were different in their response to the mycorrhizal responsiveness effects. In primer two, the results showed that the cultivars most closely related were no. (7,12), (1,5, 8,9,15) and (17,18). The results showed that cultivars no (17,18) were similar because there was no mycorrhizal responsiveness effect. While the cultivars no. (1,5,8,9,15) and (17,18) showed a difference in mycorrhizal responsiveness effects. We were interested in the results in primer 3, which presented the most similarities and affinities between the varieties. Since the cultivar no. 15 was added to no. (17,18), and they showed no mycorrhizal responsiveness effect. While the cultivars no. (1,13,16) showed a difference in their mycorrhizal responsiveness effects. Similar cultivars were increased, as we found in cultivars no. (2,3,6,7,8,9,10) with a variance in the mycorrhizal responsiveness effect.
The results in primer 4 (Fig. 17 and Fig. 18), showed affinity between the cultivars no. (14,15,16,17,18) and (1,8,10,11) with a variance in the mycorrhizal responsiveness effect. The last primer 5 (Fig. 19 and Fig. 20), showed interesting results between two genetically similar cultivars no. (3,4) where cultivar No.3 showed the most significant mycorrhizal responsiveness effect while cultivar no. 4 showed no mycorrhizal responsiveness effect. And there was a convergence between the cultivars no. (9,10) with significant mycorrhizal responsiveness effect. While the cultivars no. (5,7,12,13) and no. (16,17,18) showed a variance in the mycorrhizal responsiveness effect despite the genetic affinity.
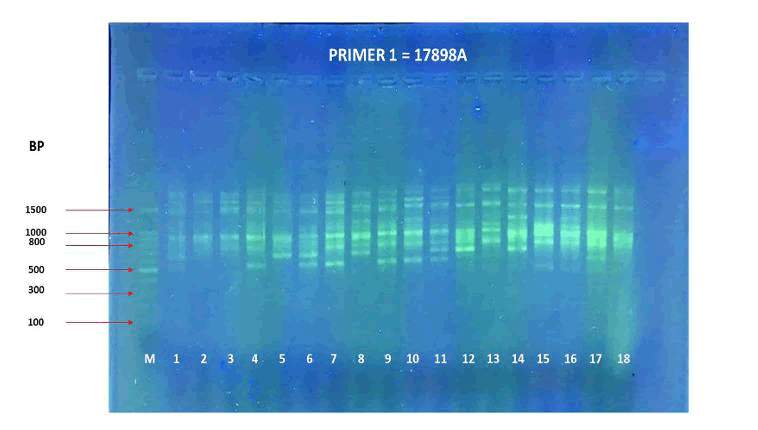
Figure 11. PCR amplification profile of 18 Zea mays cultivars using (17898A) primer.
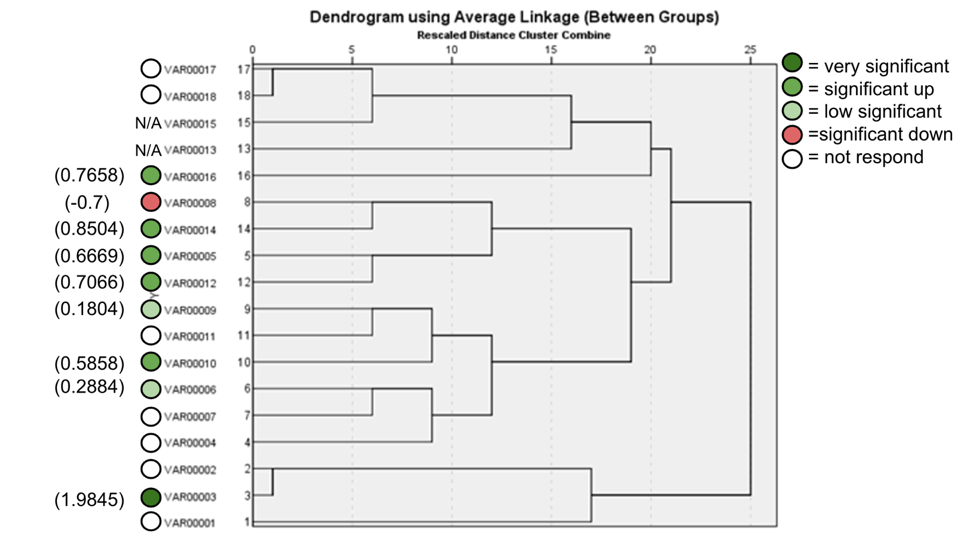
Figure 12. ISSR Phylogenetic tree of 18 Zea mays cultivars using (17898A) primer.
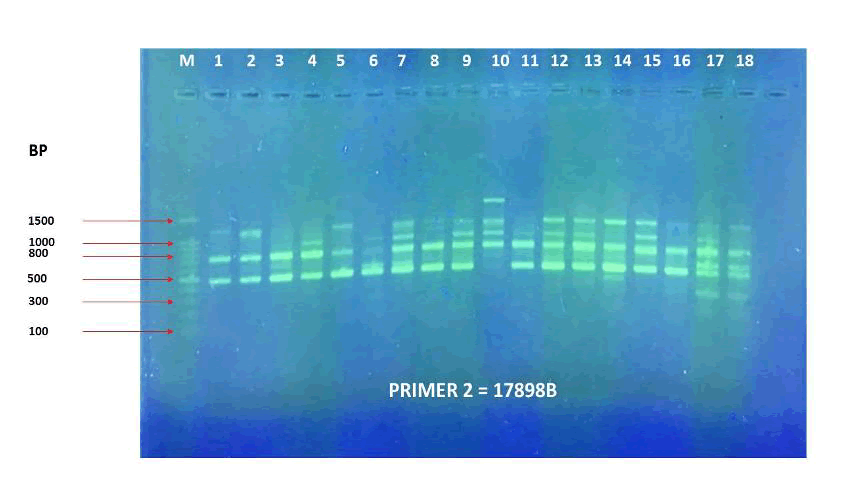
Figure 13. PCR amplification profile of 18 Zea mays cultivars using (17898B) primer.
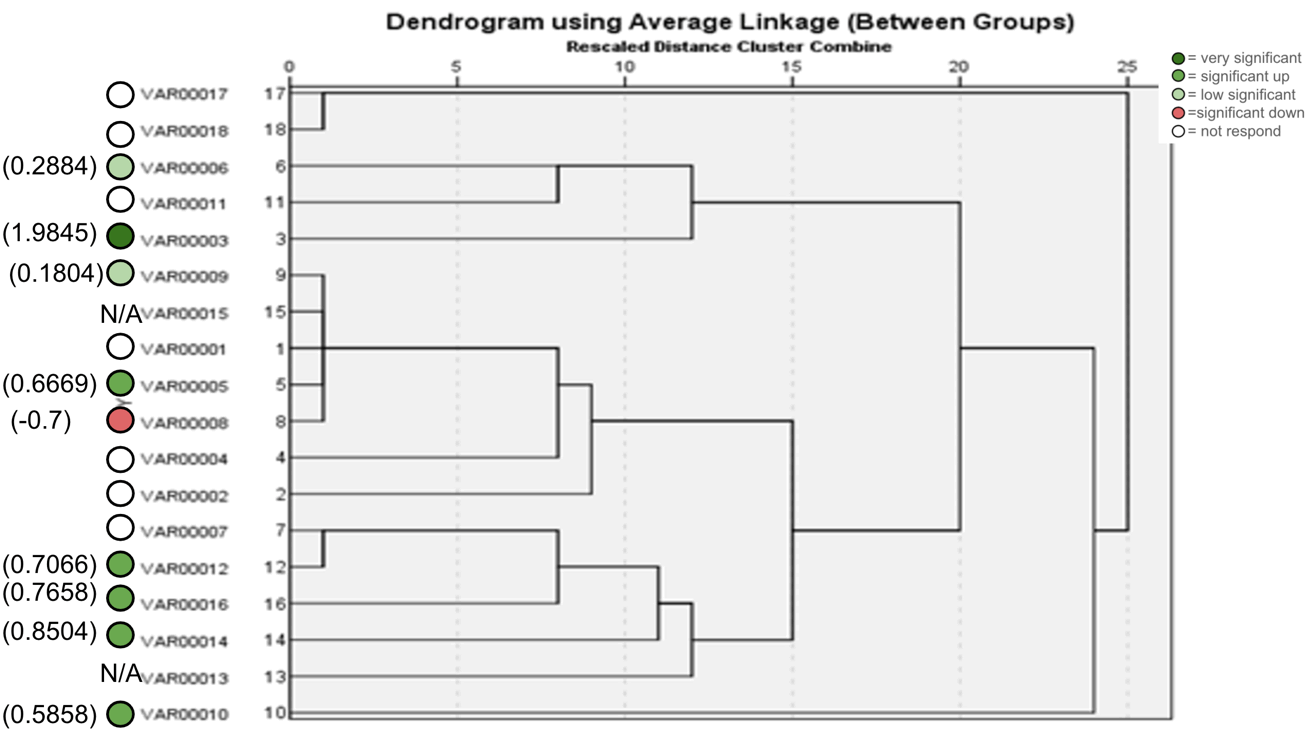
Figure 14. ISSR Phylogenetic tree of 18 Zea mays cultivars using (17898B) primer.
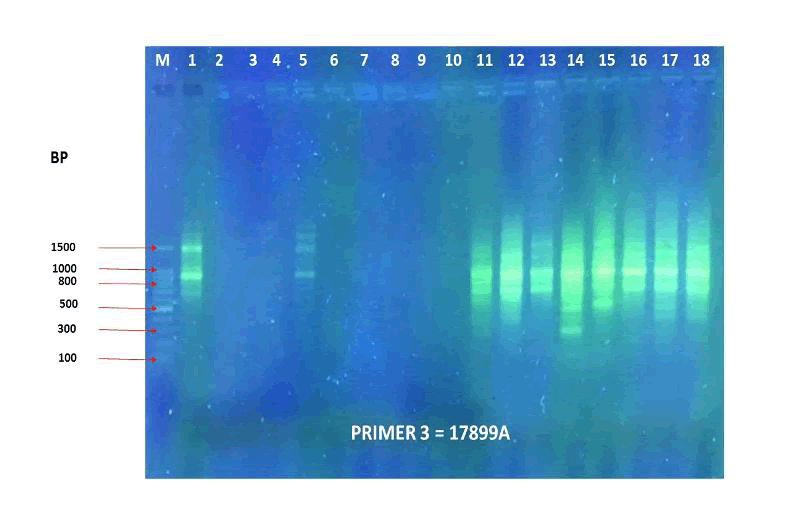
Figure 15. PCR amplification profile of 18 Zea mays cultivars using (17899A) primer.
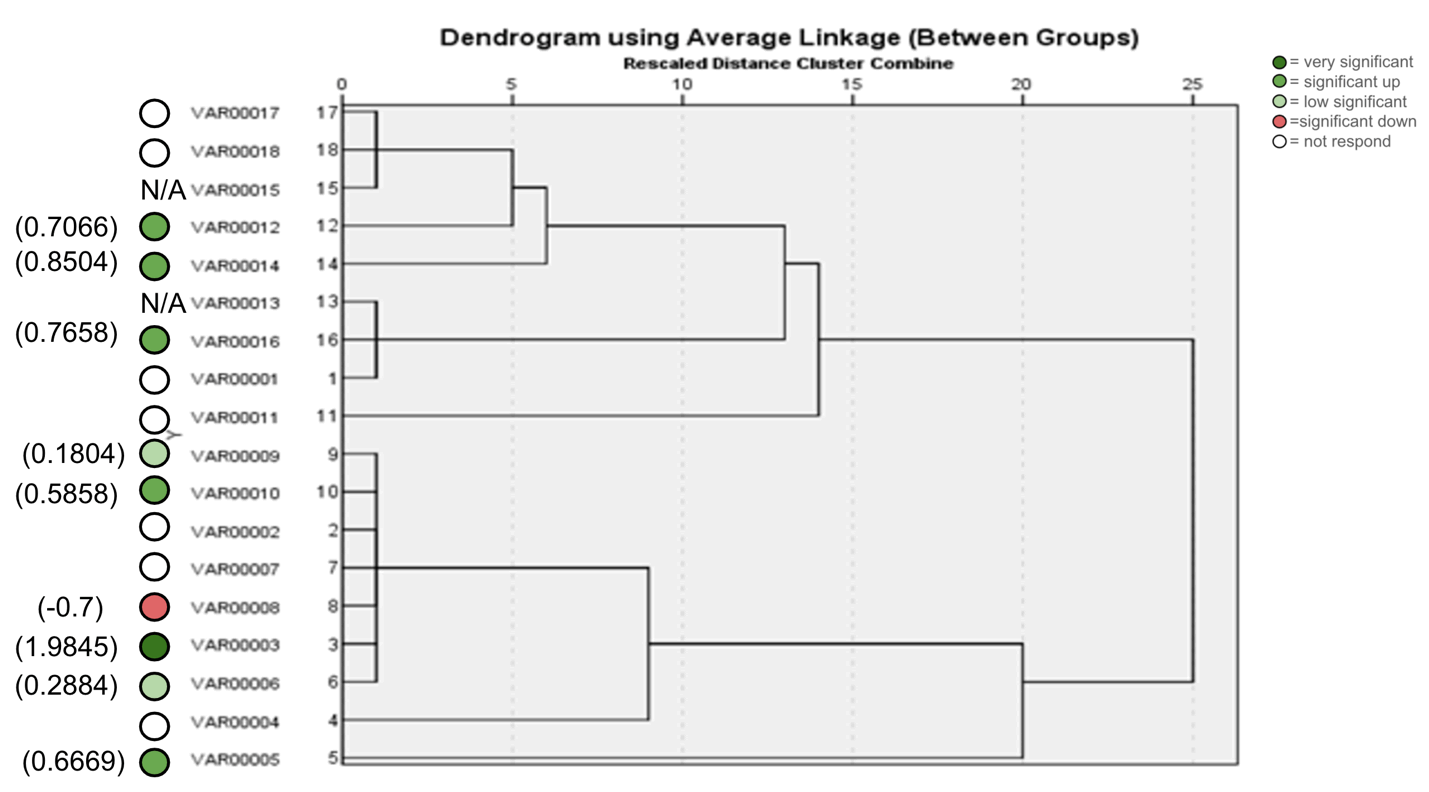
Figure 16. ISSR Phylogenetic tree of 18 Zea mays cultivars using (17899A) primer.
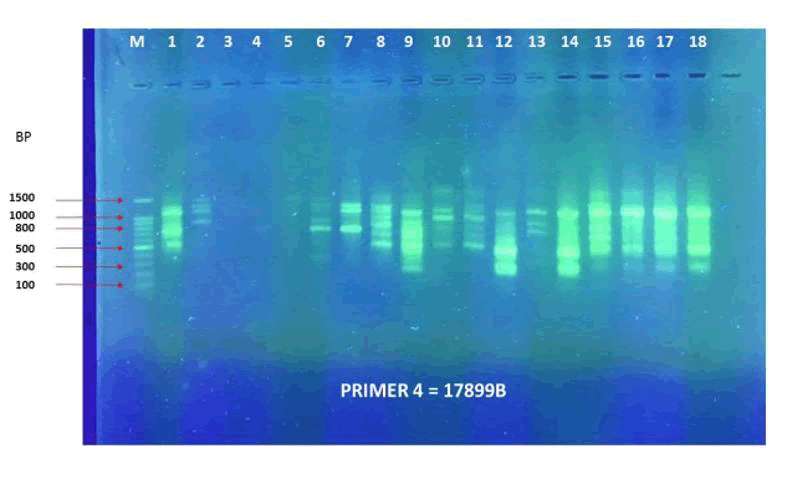
Figure 17. PCR amplification profile of 18 Zea mays cultivars using (17899B) primer.
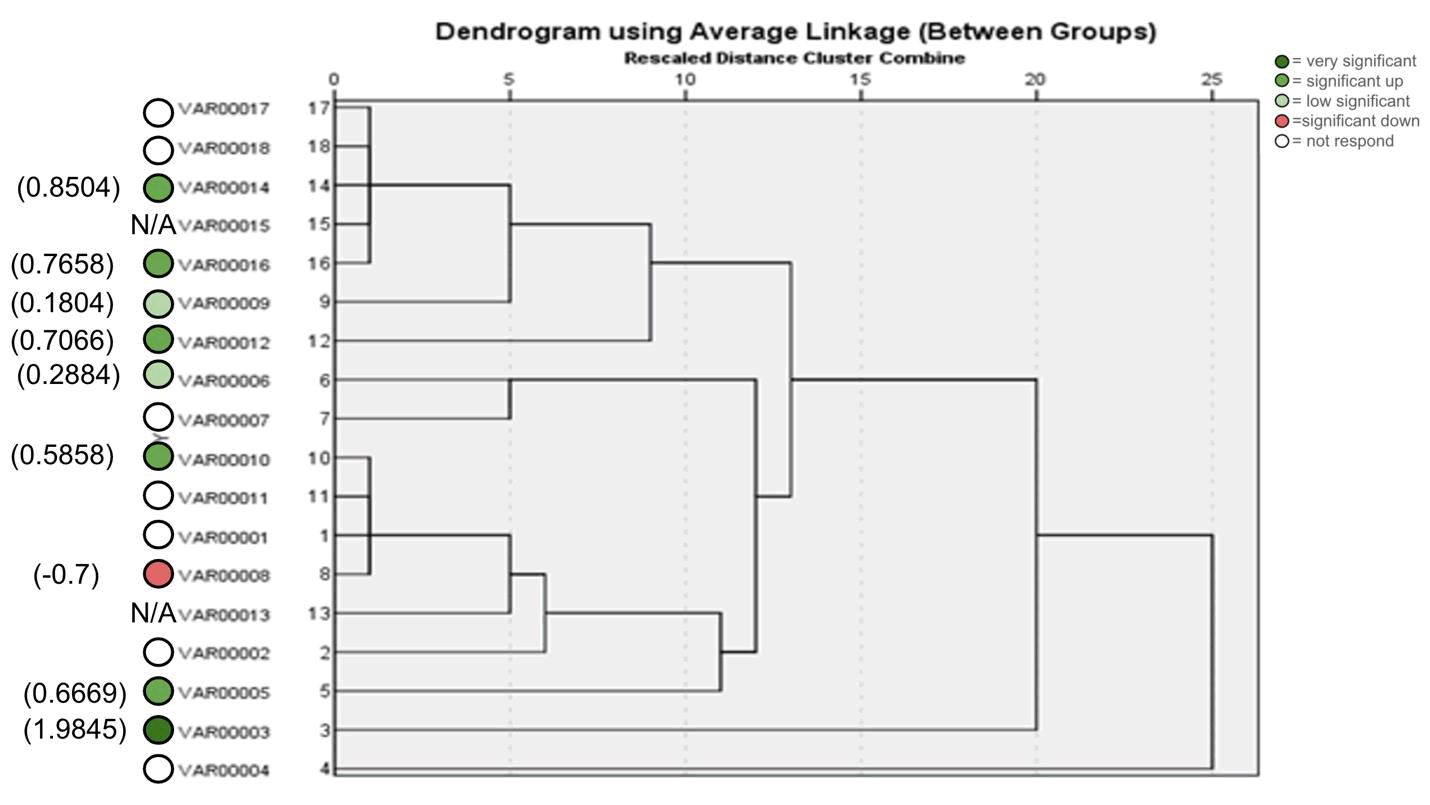
Figure 18. ISSR Phylogenetic tree of 18 Zea mays cultivars using (17899B) primer.
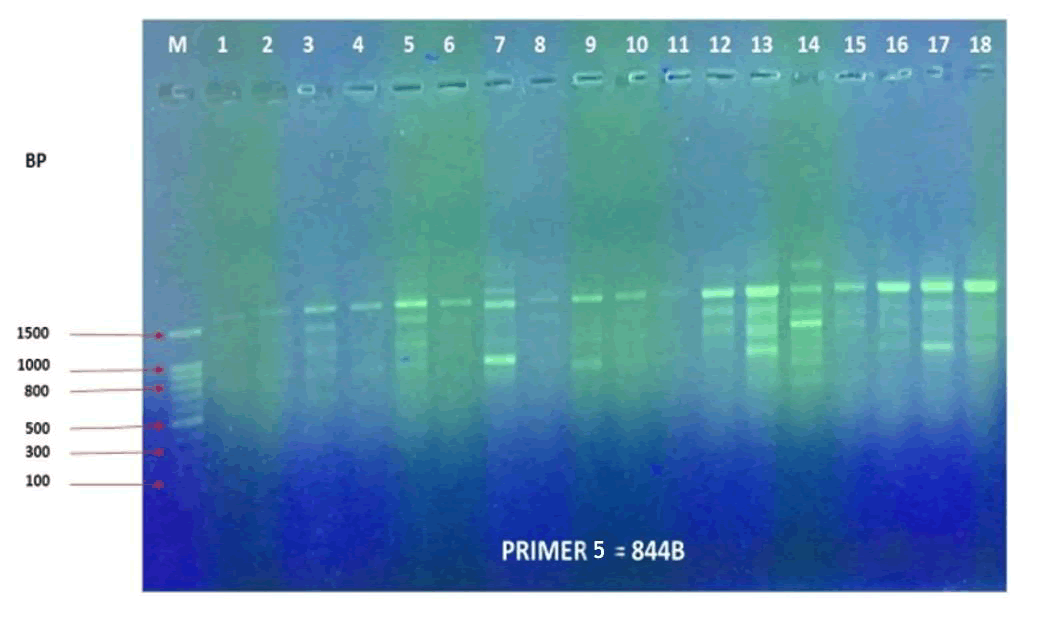
Figure 19. PCR amplification profile of 18 Zea mays cultivars using (844B) primer.
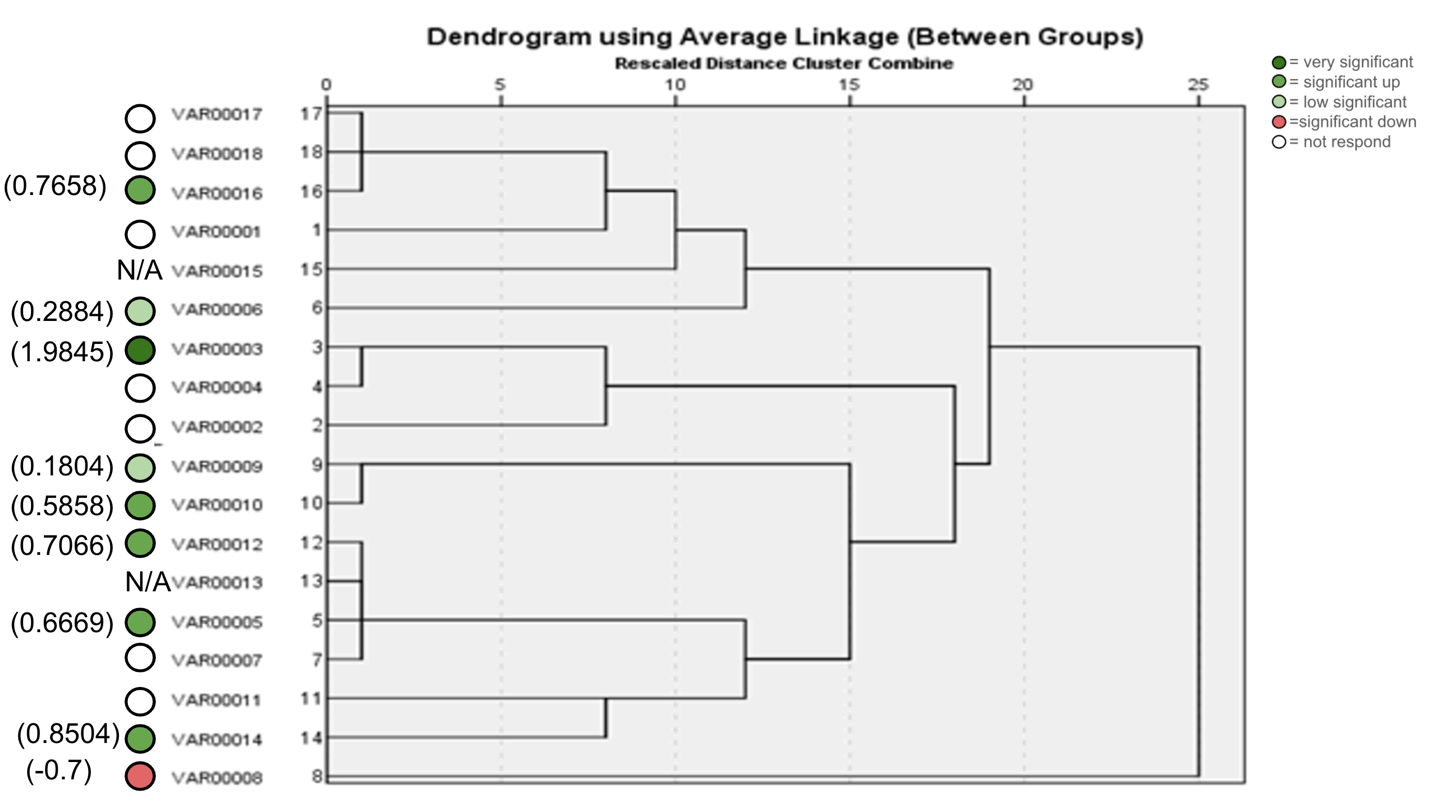
Figure 20. ISSR Phylogenetic tree of 18 Zea mays cultivars using (844B) primer.
The data extracted from the ISSR analysis indicated that the differences between the cultivars noted the evolution of the cultivars over the years, which means that the breed is stable. ISSR-PCR analysis of 18 samples of Zea mays cultivars showed that ISSR-primers used (17898A, 17898B, 17899A, 17899B and 844B) were suitable and successfully produced polymorphic DNA bands pattern, representing the high genetic diversity of the samples. However, samples from several populations have a low genetic distance. The trees divided the samples into many clusters. However, some populations showed a close genetic relationship, and the remainder did not, indicating the absence of geographical influence, and these results were supported by (Uslan & Nur Jannah, 2020). The results showed that ISSR markers may be utilized efficiently to quickly access the genetic variation in maize germplasm. In selecting the accessions for establishing a germplasm bank for the maize landscape and for developing a breeding program, information on genetic comparison and similarity will be helpful (Allier et al., 2020).
The tested responsiveness was similar in the cultivars in the lower clade in the phylogenetic tree of RBLC, which were also genetically very closed. This indicates that the evolutionary relationship can affect the plant's response to symbiosis with AMF. Still, in some clades, we found no relationship between the genetic origin and the responsiveness. We concluded from the 18S and RBCL that the effect on the responsiveness to the region in the RBCL is more than the effect on the region's response in the 18S. A common observation in the 18S and RBCL phylogenetic trees was that cultivar no. 8 was negatively responding despite the close genetic ancestry of this cultivar with others that were highly responsive. Also, that was observed in all primers of the ISSR analysis, except primer 5, which showed that cultivar no. 8 was genetically far from the responding cultivars, and here is an indication that the genetic origin may affect the response in the case of primer 5, but that differed in primer 5 in ISSR, it was the only case that the negatively responding cultivar was far away from the positively or neutral responding cultivars, but that cannot be a strong indicator that the mycorrhizal responsiveness linked to genetic origin.
An analysis of the ISSR markers separated the Zea mays cultivars into many clusters. This result corresponds to the cluster analysis of the 18S and RBCL genes but with fewer differences in the sister clusters. Such a high variation in the number of fragments produced by these primers may be attributed to the differences in the binding site throughout the genotype's genome. Ajibade et al. reported that they found the generation of the ISSR fragments ranging from 4 to 12 markers in Vigna and eight markers in Phaseolus vulgaris. The distribution of the different microsatellite sequences in different living genomes determined the possibility of using this method for DNA fingerprinting. This indicates that the ISSR marker is applicable in assessing molecular relativity among species of Zea mays.
In crop development, genetic diversity is a significant determinant of germplasm efficiency. A population with a high level of genetic variety is an excellent resource for widening the genetic basis in any breeding program. The genetic variations discovered in some of the landraces were relatively narrow, which could have come from the species' long agricultural history as an adaptation to local agro-climatic conditions and could be related to a restricted genetic base (Seehalak et al., 2006). Porter & Sachs, (2020) suggested that due to randomized genetic processes such as drift and increased breeding in agriculture, alleles that disrupt symbiosis accumulate, and specific alleles can disappear. Because selection does not oppose them, the lack of selection on symbiosis traits in agriculture accumulates randomly for alleles that disrupt symbiosis. Hetrick et al., (1992) discovered a significant genetic difference in colonization level between species. However, the variance in AM colonization among genotypes of each plant species and the variables that determine genetic variation still need to be thoroughly understood; even though the variation and factors are crucial components for analysing and optimising AM symbiosis. Likewise, An et al., (2010) clarified that maize germplasms may help to explain how AM colonization changes with plant genotype and may provide knowledge that can be used to construct sustainable agroecosystems.
Furthermore, Toth et al., (1990) suggested that colonization decreased for disease-resistant lines relative to susceptible lines in 13 maize Zea mays inbred lines. These previous findings indicate that plant breeding programs influence AM colonization; however, the data analyzed in these studies were obtained by assessing a limited number and range of plant genotypes and cannot be used to determine conclusively if and how colonization varies in response to breeding programs. McCouch, (2004) recorded that Natural genetic diversity is a critical source for developing desirable traits in plant breeding programs. However, genetic heterogeneity in AM colonization was influenced by development stage and cropping year, thus, great attention must be used when selecting such locations and genotypes (An et al., 2010). While mycorrhizal responsiveness is a heritage trait, it has not been considered to be a trait in breeding P-efficient crops (Kaeppler et al., 2000; Kapulnik & Kushnir, 1991). Mycorrhizal colonization made the most significant contribution to the first principal component of high-P soil among all mycorrhizal traits in the study genotypes of maize. This resembles the previous research (An et al., 2010), in which AM colonization of the maize was linked to the release year, and modern hybrids displayed substantially higher values than inbred lines and older landraces.
In general, modern agriculture faces the challenge of increasing food production in times of declines in agricultural land and rapid depletion of phosphate rock supplies (Gilbert, 2009). Attempts at improving the P nutrition of plants have led to variable results by adding the AMF in fields (Lekberg et al., 2008). Since AMF in agricultural soil and commonly colonize crop plants is ubiquitous, a better approach to improving the efficiency of P uptake may be to breed intensely reacting crop varieties to indigenous AMF. The results of this study show that the percentage of the colonized root length may be an essential parameter for breeding varieties with increased mycorrhizal response in the presence of productive AMF. Li et al., (2021) clarified that although modest trends occur, the notion that modern top maize varieties have lost advantageous features for nutrient uptake is unsubstantiated for the entire pool of maize. Lines linked with improved P-acquisition efficiency in limited P availability should be used to breed more sustainable cultivars. Hohmann & Messmer, (2017) clarified that there was no significant correlation between mycorrhizal responsiveness and mycorrhization; there were also several more studies which showed that there was no positive correlation between mycorrhization and mycorrhizal responsiveness by biomass, P in the shoot, or grain yield (Kaeppler et al., 2000a; Leiser et al., 2016; Smith & Smith, 2012).
The population of genetic variation for mycorrhizal responsiveness that can be attributed to differences in plant-microbe interaction vs. the population that can be attributed to the P test level is an essential issue in interpreting study results that agreed with (Kaeppler et al., 2000) and that is they can be a degree to which a genotype can respond. Plant genetic diversity was determined using RBCL gene sequences as a core plant DNA barcoding marker (Kesanakurti et al., 2011). We found that RBCL will be very useful for barcoding Zea mays that grow in Saudi Arabia. The genetic diversity found in this study is a resource that may be leveraged to conduct hybrid breeding successfully. This study found that employing ISSR markers to characterize genotypes molecularly is an effective method. (Júnior, 2011) discovered genetic diversity among maize genotypes using 15 ISSR primers and amplified 266 bands, 228 (88.9%) of which were polymorphic. Similarly, (Najaphy et al., (2012) used ISSR markers to evaluate genetic diversity in wheat genotypes and detected adequate polymorphisms and reproducible fingerprint profiles.
People are familiar with the relationship between plants and microbes and its benefits. This relationship is nutritional and is important in modern agriculture systems. It will be necessary for future facilities. However, people have forgotten and ignored that these symbioses reprogram the biochemistry of the entire plant, not just the root system. Our data shows that the presence of mycorrhizas completely alters the entire plant. The signals generated by the shoot and root, both above and underground, could be key in suppressing disease sustainability.
Conclusion
The results we found in the trees contradict our hypothesis. The results showed that the clades sometimes had different mycorrhizal responses, suggesting that there is no strong selection pressure against mycorrhization. This also implies that mycorrhizal responsiveness is not strongly selected for, and non-mycorrhizal cultivars may have developed due to genetic drift. The reason they are not selected is that they still perform well in the high-input agricultural systems prevalent across the Arabian Peninsula.
The maize plant has a vast range of genetic diversity, which presents great opportunities for genetic improvement despite the challenges mentioned earlier. ISSR markers have shown varying abilities in distinguishing between individuals and detecting genetic variations. The use of ISSR molecular markers in molecular methods has proven to be effective in quickly identifying different commercial maize seed varieties. This discovery provides enough variation to distinguish between maize cultivars from Saudi Arabia, which can be valuable for future maize breeding programs and research analysis.
References
- Huang M, Tang J, Yang B, Zhu Q. (2016). Classification of maize seeds of different years based on hyperspectral imaging and model updating. Comput Electron Agric. 122:139-145.
- Stromberg PM, Pascual U, Bellon MR. (2010). Seed systems and farmers’ seed choices: The case of maize in the Peruvian Amazon. Human Ecology. 38:539-553.
- Flint-Garcia SA, Bodnar AL, Scott MP. (2009). Wide variability in kernel composition among maize inbreds, landraces, and teosinte. Theor Appl Genet. 119:1129-1142.
- Pascual U, Perrings C. (2007). Developing incentives and economic mechanisms for in situ biodiversity conservation in agricultural landscapes. Agr Ecosyst Environ. 121:256-268.
- Badstue LB, Bellon MR, Berthaud J, Ramírez A, Flores D, Juárez X. (2007). The dynamics of farmers’ maize seed supply practices in the Central Valleys of Oaxaca, Mexico. World Development. 35: 1579-1593.
- Zhang X, Liu F, He Y, Li X. (2012). Application of hyperspectral imaging and chemometric calibrations for variety discrimination of maize seeds. Sensors. 12:17234-17246.
[Crossref] [Google Scholar] [PubMed]
- ReyesâGarcía V, Vadez V, Martí N, Huanca T, Leonard WR, Tanner S. (2008). Ethnobotanical knowledge and crop diversity in Swidden fields: A study in a native Amazonian society. Hum Ecol. 36:569-580.
- Wright SI, Bi IV, Schroeder SC, Yamasaki M, Doebley JF, McMullen MD, Gaut BS. (2005). Evolution: The effects of artificial selection on the maize genome. Science. 308:1310-1314.
[Crossref] [Google Scholar] [PubMed]
- Yamasaki M, Tenaillon MI, Bi IV, Schroeder SG, SanchezâVilleda H, Doebley, JF, Gaut BS, McMullen, MD. (2005). A large-scale screen for artificial selection in maize identifies candidate agronomic loci for domestication and crop improvement. Plant Cell. 17:2859-2872.
[Crossref] [Google Scholar] [PubMed]
- Hamblin MT. (2006). Challenges of detecting directional selection after a bottleneck Sorghum bicolor. Genetics. 173:953–964.
- Hyten DL, Song Q, hu Y, Choi IY, Nelson RL, Costa JM, Specht JE, Shoemaker RC, Cregan PB, Tanksley SD. (2006). Impacts of genetic bottlenecks on soybean genome diversity. Proc Natl Acad Sci. 103:5454-5459.
- Tang T, Lu J, Huang J, He J, McCouch SR, Shen Y, Kai Z, Purugganan MD, Shi S, Wu CI. (2006). Genomic variation in rice: Genesis of highly polymorphic linkage blocks during domestication. PLoS Genetics. 2:1824-1832.
[Crossref] [Google Scholar] [PubMed]
- Debasis P, Paramjit K. (2001). Wheat biotechnology: A mini review. Electron J Biotechnol. 4:74-102.
- Qi LL, Echalier B, Chao S, Lazo GR, Butler GE, Anderson OD, Akhunov ED, DvoÅák J, Linkiewicz AM, Ratnasiri A, Dubcovsky J, BermudezâKandianis CE, Greene RA, Kantety R, La Rota CM, Munkvold JD, Sorrells SF, Sorrells ME, Dilbirligi M, Gill BS. (2004). A chromosome bin map of 16,000 EST loci and gene distribution among the three genomes of polyploid wheat. Genetics. 168.
- AbdelâMawgood AL, AlâDoss AA, Abdellatif T. (2005). Genetic diversity in an isolated population of Capparis dicidua. 82-83.
- Crozier RH. (1997). Preserving the information content of species: Genetic diversity, phylogeny, and conservation worth. Annu Rev Ecol Syst. 28:243-268.
- Schaal BA, Hayworth DA, Olsen KM, Rauscher JT, Smith WA. (1998). Phylogeographic studies in plants: Problems and prospects. Molecular Ecology. 7.
[Crossref] [Google Scholar] [PubMed]
- Bachman MS, Tamulonis JP, Nickell CD, Bent AF. (2001). Molecular markers linked to brown stem rot resistance genes, Rbsâ¯1 and Rbsâ¯2, in soybean. Crop Sci. 41.
- Dubcovsky J. (2004). Marker-assisted selection in public breeding programs: The wheat experience. Crop Sci. 44:1895-1898.
- Zhao J, Kong Y, Guo J, Chi S, Wei D, Guo Q, Zhao JR, Kong YF, Guo JL, Chi SM, Wei DM, Guo Q. (1997). A study on the purity of hybrid maize Nongda 108 through DNA fingerprint identification. Beijing Agric Sci. 16:1-2.
- Camlin MS. (2003). Plant cultivar identification and registration the role for molecular techniques. Acta Horticulturae. 625: 37–47.
- Rao NK. (2004). Plant genetic resources: Advancing conservation and use through biotechnology. Afr J Biotechnol. 3:136-145.
- Bustin S.â¯A. (2000). Absolute quantification of mRNA using realâtime reverse transcription polymerase chain reaction assays. J Mol Endocrinol. 25:169–193.
- Chen K, Fessehaie A, Arora R. (2012). Selection of reference genes for normalizing gene expression during seed priming and germination using qPCR in Zea mays and Spinacia oleracea. Plant Mol Biol Rep. 30.
- Goidin D. (2001). Ribosomal 18S rRNA prevails over GAPDH and βâactin in melanoma subpopulations. Anal Biochem. 295.
- Jarošová J, Kundu JK. (2010). Validation of reference genes as internal control for studying viral infections in cereals by quantitative real-time RT-PCR. BMC Plant Biol. 10:146.
[Crossref] [Google Scholar] [PubMed]
- Maroufi A, vanâ¯Bockstaele E, deâ¯Loose M. (2010). Validation of reference genes for gene expression analysis in chicory (Cichorium intybus) using quantitative real-time PCR. BMC Mol Biol. 11.
- Nicot N, Hausman JF, Hoffmann L, Evers D. (2005). Housekeeping gene selection for real-time RTâPCR normalization in potato during biotic and abiotic stress. J Exp Bot. 56.
- BogdanoviÄ MD, DragiÄeviÄ MB, TaniÄ NT, TodoroviÄ SI, MišiÄ DM, ŽivkoviÄ ST, Tissier A, SimonoviÄ AD. (2013). Reverse transcription of 18S rRNA with poly(dT)18 and other homopolymers. Plant Mol Biol Rep. 31:55-63.
- Palmer JDK, Jansen HJ, Michaels MK, Chase MW, Manhart JR. (1988). Chloroplast DNA variation and plant phylogeny. Ann Missouri Bot Gard. 75:1180-1206.
- Parson W, Pegoraro K, Niederstätter H, Föger M, Steinlechner M. (2000). Species identification by means of the cytochrome b gene. Int J Legal Med. 114:23-28.
[Crossref] [Google Scholar] [PubMed]
- Roy S, Tyagi A, Shukla V, Kumar A, Singh UM, Chaudhary LB, Datt B, Bag SK, Singh PK, Nair NK, Husain T, Tuli R. (2010). Universal plant DNA barcode loci may not work in complex groups: A case study with Indian Berberis species. PLoS One. 5:e13674.
- Hasebe M. (1994). RBCL gene sequences provide evidence for evolutionary lineages of leptosporangiate ferns. Proc Natl Acad Sci USA. 91:5730–5734.
- Les DH, Garvin DK, Wimpee CF. (1991). Molecular evolutionary history of ancient aquatic angiosperms. Proc Natl Acad Sci. 88:10119-10123.
- Newmaster SG, Fazekas AJ, Ragupathy S. (2006). DNA barcoding in land plants: Evaluation of RBCL in a multigene tiered approach. Can J Bot. 8433:5–341.
[Crossref] [Google Scholar].
- Hollingsworth PM, Forrest LL, Spouge JL, Hajibabaei M, Ratnasingham S, van der Bank M, Chase MW, Cowan RS, Erickson DL, Fazekas AJ (2009). A DNA barcode for land plants. Proc Natl Acad Sci. 106: 12794-12797.
[Crossref] [Google Scholar] [PubMed]
- Kellogg EA, Juliano ND. (1997). The structure and function of RuBisCO and their implications for systematic studies. Am J Bot. 84:413-428.
- Hebert PDN. (2003). Biological identifications through DNA barcodes. Proc R Soc. B, 270: 313–321.
- Hollingsworth PM, Graham SW, Little DP. (2011). Choosing and using a plant DNA barcode. PLoS One. 6:e19254.
- Vijayan K. (2005). Inter simple sequence repeat (ISSR) polymorphism and its application in mulberry genome analysis. Int J Indust Entomol. 10.
- Pradeep Reddy M, Sarla N, Siddiq EA. (2002). Inter simple sequence repeat (ISSR) polymorphism and its application in plant breeding. Euphytica. 128.
- Sarwat M. (2012). ISSR: A reliable and costâeffective technique for detection of DNA polymorphism. Methods Mol Biol. 862:103-121.
[Crossref] [Google Scholar] [PubMed]
- Elsadig Idris A. (2012). Maize (Zea maysâ¯L.) genotypes diversity study by utilization of inter-simple sequence repeat (ISSR) markers. Aust J Basic Appl Sci. 6:42-47.
- Jana Å¢, Slavomíra S, Milan B, Katarína R, Masnica M, Mária L. (2013). ISSR markers as a tool to distinguish Idt and SSS populations of Zea maysâ¯L. J Cent Eur Agric. 14:11–21.
- Osipova ES, Koveza OV, Troitskij AV D, olgikh YI, Shamina ZB, Gostimskij SA. (2003). Analysis of specific RAPD and ISSR fragments in maize (Zea maysâ¯L.) somaclones and development of SCAR markers on their basis. Genetika. 39:1664-1672.
[Crossref] [Google Scholar] [PubMed]
- Sabir JSM, AboâAba S, Bafeel S, Zari TA, Edris S, Shokry AM, Atef A, Gadalla NO, Ramadan AM, AlâKordy MA, ElâDomyati FM, Jansen RK, Bahieldin A. (2014). Characterization of ten date palm (Phoenix dactyliferaâ¯L.) cultivars from Saudi Arabia using AFLP and ISSR markers. CR Biol. 337:6-18.
- George ML. (2004). Genetic diversity of maize inbred lines in relation to downy mildew. Euphytica. 135.
- AzcárateâPeril MA, Raya RR. (2001). Methods for plasmid and genomic DNA isolation from lactobacilli. In Food Microbiology Protocols. Humana Press.
- Romero LR, Tacke D, Koopmann B, von Tiedemann A. (2021). First characterisation of the Phoma species complex on maize leaves in Central Europe. Pathogens. 10:1216.
- Taerum SJ, Steven B, Gage DJ, Triplett LR. (2020). Validation of a PNA clamping method for reducing host DNA amplification and increasing eukaryotic diversity in rhizosphere microbiome studies. Phytobiomes Journal. 4.
[Crossref] [Google Scholar] [PubMed]
- Khan I, Shinwari ZK, Zahra NB, Jan SA, Shinwari S, Najeebullah S. (2020). DNA barcoding and molecular systematics of selected species of family Acanthaceae. Pak J Bot.52:205-212.
- Zhou Y, Zhang Y, He W, Wang J, Peng F, Huang L, Zhao S, Deng W. (2018). Rapid regeneration and reuse of silica columns from PCR purification and gel extraction kits. Sci Rep.â¯8:6035.
[Crossref] [Google Scholar] [PubMed]
- Larkin MA, Blackshields G, Brown NP, Chenna R, McGettigan PA, McWilliam H, Valentin F, Wallace IM, Wilm A, Lopez R, Thompson JD, Gibson TJ, Higgins DG. (2007). Clustal W and Clustal X version 2.0. Bioinformatics. 23:2947-2948.
- R Core Team. (2021). R: A language and environment for statistical computing. Vienna, Austria: R Foundation for Statistical Computing.
- Charif D, Lobry JR. (2007). SeqinR 1.0â2: A contributed package to theâ¯Râ¯Project for statistical computing devoted to biological sequences retrieval and analysis. Bioinform.
- Paradis E, Claude J, Strimmer K. (2004). APE: Analyses of phylogenetics and evolution in R language. Bioinformatics. 20:289–290.
- Goldman N. (1990). Maximum likelihood inference of phylogenetic trees Poisson process model of DNA substitution. Syst Biol. 39:345–361.
- Karapetsi L, Pantelidis G, Pratsinakis ED, Drogoudi P, Madesis P. (2021). Fruit quality traits and genotypic characterization in a pomegranate ex situ (Punica granatumâ¯L.) collection in Greece. Agriculture. 11.
- Burgos NR, Stephenson DO, Agrama HA, Oliver LR, Bond JA. (2011). A survey of genetic diversity of the weedy species Ipomoea lacunosa L. in the US MidâSouth. Am J Plant Sci. 2.
- Rohlf FJ. (1997). NTSYSâpc Version 2.02i: Numerical Taxonomy and Multivariate Analysis System.
- Edris S. (2014). Molecular characterization of tomato cultivars grown in Saudi Arabia AFLP and ISSR. Life Sci J. 11.
- Sabir JSM, AboâAba S, Bafeel S, Zari TA, Edris S, Shokry AM, Atef A, Gadalla NO, Ramadan AM, AlâKordy MA, ElâDomyati FM, Jansen RK, Bahieldin A. (2014b). Characterization of ten date palm (Phoenix dactylifera L.) cultivars from Saudi Arabia using AFLP and ISSR markers.
[Crossref]
- Sneath PHA, Sokal RR. (1973). Numerical taxonomy. In The Principles and Practices of Classification (1st ed.). W.H.â¯Freeman and Co.
- Nature eg. (2004). Monsanto wins sevenâyear court battle for seed patent. Nature. 429:330.
- Wongsawad P, Peerapornpisal Y. (2014). Molecular identification and phylogenetic relationship of green algae, Spirogyra ellipsospora (Chlorophyta) using ISSR and rbcL markers. Saudi J Biol Sci. 21:476-482.
- Uslan U, Nur Jannah. (2020). Genetic diversity of local corn (Zea mays) cultivars from South Amarasi, Kupang District, Indonesia by Inter Simple Sequence Repeats marker. Biodivers J. 21.
[Crossref] [Google Scholar]
- Allier A, Teyssèdre S, Lehermeier C, Moreau L, Charcosset A. (2020). Optimized breeding strategies to harness genetic resources with different performance levels. BMC Genomics. 21.
[Crossref] [Google Scholar] [PubMed]
- Seehalak W, Tomooka N, Waranyuwat A, Thipyapong P, Laosuwan P, Kaga A, Vaughan DA. (2006). Genetic Diversity of the Vigna Germplasm from Thailand and Neighboring Regions Revealed by AFLP Analysis. Genet Resour Crop Evol. 53.
- Porter SS, Sachs JL. (2020). Agriculture and the disruption of plant-microbial symbiosis. Trends Ecol Evol. 35.
- Hetrick BAD, Wilson GWT, Cox TS. (1992). Mycorrhizal dependence of modern wheat varieties, landraces, and ancestors. Can J Bot. 702032–2040.
- An G.âH, Kobayashi S, Enoki H, Sonobe K, Muraki M, Karasawa T, Ezawa T. (2010). How does arbuscular mycorrhizal colonization vary with host plant genotype? An example based on maize (Zea mays) germplasms. Plant and Soil. 327: 441-453.
- Toth R, Toth D, Starke D, Smith DR. (1990). Vesicular–arbuscular mycorrhizal colonization in Zea mays affected by breeding for resistance to fungal pathogens. Can J Bot. 68:940-945.
- McCouch S. (2004). Diversifying selection in plant breeding. PLoS Biol. 2: e347.
- Kaeppler SM, Parke JL, Mueller SM, Senior L, Stuber C, Tracy WF. (2000). Variation among maize inbred lines and detection of quantitative trait loci for growth at low phosphorus and responsiveness to arbuscular mycorrhizal fungi. Crop Sci. 40:358–364.
- Kapulnik Y, Kushnir U. (1991). Growth dependency of wild, primitive and modern cultivated wheat lines on vesicular-arbuscular mycorrhiza fungi. Euphytica. 56:27-36.
- Gilbert N. (2009). Environment: The disappearing nutrient. Nature. 461:716-717.
- Lekberg Y, Koide RT, Twomlow SJ. (2008). Effect of agricultural management practices on arbuscular mycorrhizal fungal abundance in lowâinput cropping systems of southern Africa: A case study from Zimbabwe. Biol Fertil Soils. 44.
- Li X, Quan X, Mang M, Neumann G, Melchinger A, Ludewig U. (2021). Flint maize root mycorrhization and organic acid exudates under phosphorus deficiency: Trends in breeding lines and doubled haploid lines from landraces. J Plant Nutr Soil Sci.
- Hohmann P, Messmer MM. (2017). Breeding for mycorrhizal symbiosis: Focus on disease resistance. Euphytica. 213.
- Leiser WL, Olatoye MO, Rattunde HFW, Neumann G, Weltzien E, Haussmann BIG. (2016). No need to breed for enhanced colonization by arbuscular mycorrhizal fungi to improve lowâP adaptation of West African sorghums. Plant Soil. 401.
- Smith SE, Smith FA. (2012). Fresh perspectives on the roles of arbuscular mycorrhizal fungi in plant nutrition and growth. Mycologia. 104:1-13. [Crossref]
[Google Scholar] [PubMed]
- Hollingsworth PM, Graham SW, Little DP. (2011). Choosing and using a plant DNA barcode . PLoS One. 6:e19254. [ Crossref ] [ Google Scholar ]
- Júnior. (2011). Assessment of genetic diversity among maize accessions using inter simple sequence repeats (ISSR) markers. Afr J Biotechnol. 10.
- Najaphy A, Parchin RA, Farshadfar E. (2012). Comparison of phenotypic and molecular characterizations of some important wheat cultivars and advanced breeding lines. Aust J Crop Sci. 6:326–332.