Research Article - Modern Phytomorphology ( 2020) Volume 14, Issue 1
Use of fractal analysis principles when describing flavonoids variety of the south trans-urals plants
Usmanov Iskander1,2, Shcherbakov Arkadiy3, Ivanov Vyacheslav4*, Ivanov Sergey5 and Gonchar Ivan62Doctor of Biological Sciences (Advanced Doctor), Professor of Economic and Turizm of the-Ufa State Petroleum Technological University, Cosmonauts St. 1, 450062, Ufa, Russia
3Candidate of Biological Sciences (Ph.D.), Leading Researcher of the Research and Innovation Enterprise Bachincom, Karla Marksa St. 37, 450015, Ufa, Russia
4Candidate of Pedagogical Sciences (Ph.D.), Associate Professor of Ecology of the Nizhnevartovsk State University, Lenina St. 56, 628605, Nizhnevartovsk, Russia
5Candidate of Chemical Sciences (Ph.D.), Deputy Laboratory Manager, Senior Researcher of the FSBI Ufa Institute of Chemistry STC of the RAS, Davletkildeev Boulevard St. 5/2, 4540098, Ufa, Russia
6Nizhnevartovsk State University, Lenina St., 56, Nizhnevartovsk, 62860, Russia
Ivanov Vyacheslav, Candidate of Pedagogical Sciences (Ph.D.), Associate Professor of Ecology of the Nizhnevartovsk State University, Lenina St. 56, 628605, Nizhnevartovsk, Russia, Tel: 79129385128, Email: karatazh@mail.ru
Received: 07-Nov-2019 Accepted: 20-Dec-2019 Published: 02-Jan-2020, DOI: 10.5281/zenodo.4453866
Abstract
Flavonoids are physiologically active substances that regulate many functions in plants and animals. Despite many years of research, interest in these substances continues unabated, and the market for flavonoids in the health industry keeps growing. In South Trans-Urals, the research team behind this paper discovered a significant fluctuation in the accumulation of flavonoids in many local plants. Significant differences were later discovered in the accumulation of physically and chemically similar flavonoids and organic substances; differences were observed between specific compounds within local coenopopulations as well as between spatially isolated populations. This research applied high-performance liquid chromatography (HPLC) to identify the significant differences between single chromatograms in terms of the following features: (1) the number of identifiable substances (chromatographic peaks); (2) peak elution times; (3) peak areas indicative of the substance-specific concentrations in the extract. The diversity of specimens and groups was described in terms of the fingerprint concept to underline the strong “specificity” of chromatograms. However, the accumulation of flavonoids and the concentration of copper, zinc, and other metal salts in the soil were in an unstable correlation. In other words, descriptive statistics failed to identify any environmental factors that clearly regulated the accumulation of flavonoids in the field.
Keywords
Flavonoids, biosynthesis of flavonoids, stochastic fractals, Glycyrrhiza korshinskyi Grig., Juniperus sabina L., South Trans-Urals
Introduction
Multiple observations have been made in recent years which show that alternative biological and ecological processes might emerge in equivalent environments. The biosynthesis of flavonoids in the real-world coenoses should thus be analyzed from the standpoints of both the conventional biochemistry and neutralist concepts (Lambers et al. 2008). Various modifications of the unified neutral theory have shown the statistically insignificant dependence of various biological processes on the environment (Kimura 1983; Hubbell 2006; Dembitsky et al. 2007; Morozov et al. 2014, Rosenberg 2013). This calls for an attempt to apply neutralist approaches to the data arrays as presented herein. Fractal analysis is a highly generalized concept of the stochastic emergence of self-similar structures (McGill 2010; Gelashvili et al. 2013). Given that the accumulation of flavonoid in plants in South Trans-Urals is in a weak correlation with environmental factors while the chromatographic spectra of single plant specimens show inter-specimen and interpopulation diversity, this research effort seeks to assess the applicability of fractal analysis to the biosynthesis of flavonoids (Amineva 2003; Ableeva 2004,Scherbakov et al. 2009, 2012, 2013).
Materials and Methods
This research used single chromatograms of Glycyrrhiza korshinskyi Grig. and Juniperus sabina L. extracts; the material was sampled in South Trans- Urals from 2009 through 2016. Taxonomically, these species are of different classes. However, they showcase similar dissemination patterns. The mid-20th century saw the mass destruction of vegetation in the form of plowing virgin lands; the ecosystems of the studied areas have been recovering ever since. The recovery of natural communities in South Trans-Urals (Yanturin et al. 2003) has led to the dissemination and wider spread of Glycyrrhiza korshinskyi Grig. and Juniperus sabina L. Both species tend to populate areas in patchwork patterns, with great distances (1 to 10 km or even more) between single coenoses. These perennials generally adapt well to such mosaic ecological niches (Usmanov et al. 2014) and compete well in the serial communities of secondary succession in South Trans-Ural steppes (Abramova et al. 2001; Faruchschina et al. 2011).
Plant samples were analyzed in three replications at two analytical wavelengths.
To measure the flavonoids, alcohol extracts were chromatographed on a Luna C18 250×4.6 mm, 5 μm column in a reverse-phase system. Flavonoids were measured in the above-ground organs of licorice and juniper by HPLC. The analysis used the Sigma-Aldrich standards: baicalein, hesperetin, fisetin, naringin, naringenin, rutin, quercetin, isoquercetin, morin, dihydroquercetin, and liquiritigenin 92% minimum purity. Flavonoid standards and the substances in samples were detected at 275 and 360 nm on a diode-matrix UV analyzer. Standards and substances in specimens were detected at 360 nm.
• Fractal analysis was applied to verify the fractal characteristics of three groups of plant specimens sampled in the area
• Chromatograms of Juniperus sabina L., a total of 267 chromatograms of plants from different locations
• Chromatograms of Glycyrrhiza korshinskyi Grig., a total of 158 chromatograms of plants from different locations
A set of flavonoids as described in literature. This group was for the compounds whose metabolic biosynthesis pathways are known. Assessing a random set of compounds described in literature helps assess the applicability of fractals to the entire flavonoid biosynthesis system regardless of whether this or that compound is described in literature (Gelashvili et al. 2013).
Fractal analysis
Calculations used the method by Gelashvili et al. 2013. Step one was to pick specimens and to define the general logic for grouping them into ever larger samples. This determined the further procedure for compiling a hierarchical matrix fractal analysis would need. This was a two-step procedure:
• Sampling to identify a uniform structure verifiable for self-similarity, i.e. to identify a supposed self-similar structure underlying the fractal hierarchy
• Scaling to identify the scale and range of hierarchical levels, at which the self-similarity was expected to arise in this structure
For Glycyrrhiza korshinskyi Grig. and Juniperus sabina L. chromatograms, hierarchical sampling was done by merging the data as follows:
• Level 1 for single specimens
• Level 2 for descriptions grouped in pairs
• Level 3 for descriptions in groups of four, etc. (Fig. 1).

Figure 1. Hierarchical matrix construction for fractal chromatogram analysis.
The highest percentage of the living explants procured from seedlings was obtained in variant No 10 (76%). In our opinion, this is due to the fact that juvenile plants are less contaminated. Thus, the explants from the selected plus trees (the experiment variant No 10) were of the greatest height (12 mm).
The elementary self-similar unit of hierarchy was the chromatogram of a standard plant sample. Each chromatogram was described in terms of three parameters:
• Peak elution time in a standard solvent system
• Peak areas in millivolts, linearly linked to the concentration of this substance
• The number of peaks registered in each chromatogram
Chromatograms were merged on the peak elution time axis ranging from the fastest one (the leftmost one in the chromatogram) to the slowest one regardless of whether the extreme peaks were in the same chromatogram or in different ones. In case two or more chromatograms had peaks eluting at the same time, this substance was counted for in all specimens. If a peak was found in one chromatogram but absent in another one, the “new” peak was placed at the corresponding time-scale point, and the substance was only deemed present in this specimen. For each hierarchy level, the generalized chromatogram was essentially a merger of all the peaks identified in specific groups. The total number of substance-specific peaks in the merged chromatogram far exceeded that in any single chromatogram. The approach was virtually a conventional geobotanical technique for describing general populations of species pertaining to specific biogeocenoses and landscapes ranked correspondingly (Mirkin et al. 2012). This approach effectively generates a set of substances synthesized in a single plant (if sampled from different parts of a plant), in a single coenopopulation, in an arbitrary population group, or in all analyzed local plants.
The hierarchy was used to create a generalizing matrix to calculate:
• N, the total sample size. This value varied from 1 (a single specimen) to 8 for Glycyrrhiza korshinskyi Grig., from 1 to 10 for Juniperus sabina L
• pi, the diversity index, i.e. the proportion of each compound in the plant
• q is the order of the moment of distribution. This value varied from-3 to 3 as recommended by the authors and was essentially the range of powers, to which pi for each element had to be raised. Thus, this indicator was the scaling factor, at which the fractality of studied phenomena would be verified
• Mq are the moments of substance-class distributions. This value was calculated by the authors-recommended formula (Gelashvili et al. 2013)
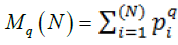
Where, see above for the values.
The first step was to calculate Mq values for each q. Selfsimilarity is considered proven if logMq is in significant correlation with logN across the q range (Gelashvili et al. 2013). Thus, self-similarity is the first condition of being in line with the principles of fractal formalism. However, self-similarity, as stated in (Gelashvili et al. 2013), can be observed in regular objects that follow relatively simple patterns, in which the observed variables are in a strict functional dependence.
Whether the observed phenomenon could not be reduced to simple mathematical models was assessed by Gelashvili D.B. et al. (2013) by the Akaike information criterion (AIC). To assess the dependence of log Mq on log N, the authors behind the methodology proposed two models: a linear model and a quadratic model.
For small samples, the criterion was calculated as
foll 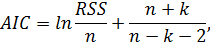
• Where, n-is the analyzed data sample size
• k-is the number of model parameters (3 for the linear model, 4 for the quadratic model)
• RSS-is the total of squares of deviations from the model-predicted values
• The AIC was calculated for both models across the entire q range (Gelashvili et al. 2013)
It had higher values for the quadratic model than for its linear counterpart across the entire range, a sign of fractal (multifractal) properties being present in the specimen. The authors’ experience shows that for a fully regular structure, the AIC is higher for the linear model than for its quadratic counterpart for q=0 to q=1.5. Thus, such structures do not meet the second condition of multifractality.
Thus, the self-similarity of the specimens was verified in terms of the validity of linear dependence between N and Mq logarithms, while the applicability of the fractal hypothesis was verified by comparing the AIC for linear and quadratic models (Gelashvili et al. 2013).
Results and Discussion
Self-similar structure selection procedure: rationale
For a self-similar structure, the researchers used a single chromatogram of varying configuration and number of peaks. A single chromatogram was used as neither in theory, nor in practice was it possible to identify all the phenolic molecules in single specimens. This is why a single chromatographic profile of a single plant was used as the elementary self-similar structure. Each chromatogram had Sigma Aldrich standardidentified flavonoids located on different branches of their metabolic network: baicalein, hesperetin, fisetin, naringin, naringenin, rutin, quercetin, isoquercetin, dihydroquercetin, liquiritigenin, and fisetin.
Sequential scaling was applied in the range from a single chromatogram of a single-plant extract via single coenopopulations distanced at 100 or more km to the generalized chromatograms covering the entire area, see the methodology above. The experiments with Glycyrrhiza korshinskyi Grig. and Juniperus sabina L. chromatograms were designed to compare the organization of chromatograms of plants in the populations distributed spatially in the Trans-Ural peneplain (Fig. 2 and 3).

Figure 2. Chromatograms of Juniperus sabina L. alcohol extracts of four different populations. Note: 1-rutin: peak release time-10.2-10.8 min.; 2-naringin: 11.6-11.9 min.; 3-dihydroquercitin: 12.1-12.6 min.; 4-fizetin: 13.1-13.5 min.; 5-likviritigenin: 14.7 min.; 6-quercitin: 14.8- 15.3 min.; 7-naringenin: 16.3-16.7 min.; 8-bajkalein: 16.9-17.4 min.

Figure 3. Chromatograms of Glycyrrhiza korshinskyi Grig. alcohol extracts of four different populations. Note: 1-rutin: peak release time-10.2-10.6 min.; 2-naringin: 11.6-11.8 min.; 3-dihydroquercitin: 12.1-12.6 min.; 4-fizetin: 13.1-13.5 min.; 5-likviritigenin: 14.8 min.; 6-quercitin: 14.8-15.3 min.; 7-naringenin: 16.3-16.7 min.; 8-bajkalein: 16.9-17.4 min.
For Juniperus sabina L. chromatograms, the hierarchical matrix was constructed based on the same principle as the licorice chromatograms. A total of 158 chromatograms were used originally.
Fractal analysis results
Table 1 presents the self-similarity analysis of the generalizing matrix of Glycyrrhiza korshinskyi Grig. chromatograms.
| q | q=0.2 | q=0.3 | q=0.5 | q= 1.5 | q=2 | q=2.5 |
| Correlation coefficient | 0.888 | 0.888 | 0.864 | 0.864 | 0.817 | 0.817 |
| p-level | 0.00 | 0.00 | 0.00 | 0.00 | 0.00 | 0.00 |
Table 1. log N and log Mq correlation analysis for Glycyrrhiza korshinskyi Grig.
Thus, the generalizing matrix of the Glycyrrhiza korshinskyi Grig. the chromatogram was proven selfsimilar.
The second condition (irreducibility to a simple linear model) was met, too, as there was a reason to assume the chromatographic profile of Glycyrrhiza korshinskyi Grig. could be of a fractal nature (Fig. 4).

Figure 4. The criterion value for the linear and quadratic models describing the patterns of the detected flavonoids in the Glycyrrhiza korshinskyi Grig.
The self-similarity analysis of the generalizing matrix of Juniperus sabina L. chromatograms (Tab. 2).
| q | q=0.2 | q=0.3 | q=0.5 | q= 1.5 | q=2 | q=2.5 |
| Correlation coefficient | 0.80 | 0.80 | 0.80 | 0.80 | 0.78 | 0.76 |
| p-level | 0.00 | 0.00 | 0.00 | 0.00 | 0.00 | 0.00 |
Table 2. log N and log Mq correlation analysis for Juniperus sabina L.
Thus, the generalizing matrix of the Juniperus sabina L. chromatogram was proven self-similar.
The second condition (irreducibility to a simple linear model) was met (Fig. 5). Thus, Juniperus sabina L. can be deemed fractal, whether for single plants or for the whole Juniperus sabina L. habitat in the South Trans-Urals.

Figure 5. The criterion value for the linear and quadratic models describing the patterns of the detected flavonoids in the Juniperus sabina L.
Consider the ratio of single and general chromatograms as a practical manifestation of the set of the extracted substances being fractal.
Single chromatograms vs. each other
None of the chromatograms in the general sample was identical to any of its counterparts. Comparing the chromatograms by the peak elution time or the presence/ absence of individual peaks by means of the Koch similarity measure showed no similarity between the chromatograms, as the value was in a range of 500 to 600. The peak values (concentration) of the substance differed more significantly. This applied to both inter-specimen and inter-population comparisons.
General vs single chromatograms
For both species, general chromatograms comprised 100 to 120 compounds. Single chromatograms had 15 to 35 peaks. Thus, the general population could synthesize 5 to 10 times more different compounds than a single plant. The general chromatograms had all the compounds encountered at least once in at least one plant in any coenopopulation of the region. However, not a single chromatogram was close to the general one in terms of how many different compounds it featured. Thus, the single-to-general chromatogram ratio was qualitatively in line with Kimura’s and Hubbell’s standpoint.
Individual compound spectra generation
Plants have a common procedure for choosing a single compound from many. This gives rise to a question: a compound is synthesized as a strictly deterministic response to this or that combination of soil factors, or is but one of many ecologically equivalent (Hubbell 2001, 2006; Gaston, Choun 2005) or biologically equivalent (Scherbakov 1997) responses? In the latter case, the biosynthesis of this or that compound is a neutral response as it does not pertain to the soil composition specific of the habitat (Hlyostkina et al. 2014).
the response is deterministic, some factor(s) of the environment, such as the concentration of metal/non metal compounds in soil samples, are expected to induce the synthesis of a single compound or of multiple similar compounds. If that is the case, concentration gradients in different soil samples might be expected to show significant (+/-) correlations between the soil reading series and the chromatographic peak series. On the other hand, significant correlations are not necessary if the flavonoid synthesis is neutral to environmental factors. The herein described chromatogram experiments showed that fractal self-similarity had occurred due to the fact that the number of compounds did not correlate with their properties.
However, how can a random set of compounds (chromatographic peaks) be formed? It is known that virtually any organic compound is synthesized when an elementary substrate enzyme (gene) product cell is triggered, i.e. the events within such a cell are strictly deterministic and mutually conditioned (Korulkin 2007; Petrussa et al., 2013; Harborne 2013).
Conclusion
The biosynthesis of flavonoids is a classical tree that starts from a single precursor (naringenin chalcone) and forms multiple branching metabolic chains. Transitions between substances follow general radical replacement or attachment patterns. In any case, any substance must feature a continuous successive biosynthesis chain from the original naringenin chalcone molecule to the substance. In addition, flavonoid biosynthesis uses multiple alternative pathways (shunts) to connect adjacent chains. The total number of shunts is currently unknown.
Each new substance in the metabolic tree is formed if there is an elementary conductive metabolic cell: substrate > enzyme (gene) > product. Only a network consisting of such elementary cells can synthesize a flavonoid. Continuity is fundamental for metabolic chains, as the “ultimate” substance will only appear if the preceding chains are in continuity. However, a conductive metabolic cell is itself subject to multiple regulatory effects at genetic, substrate, physiological, and ecological levels.
It can be assumed that the flavonoid biosynthesis system forms a network where any point is connected to any other point by multiple routes including shunts that might have not yet been described in literature. Multiple observations confirm that each specific flavonoid biosynthesis has a pronounced activation and inhibition system. It is the branched networks and shunts that enable bypassing this or that activator-inhibitor combination via other metabolic cells, for which this combo is not critical.
Apparently, this calls for an approach that applies fractal ideology to the percolation theory that covers the condition of substrate (substance or signal) dissemination (“flowing”) via a randomly heterogeneous medium. The emergence of this or that compound is the product of “flowing” through different conductive metabolic cells involved in precursor synthesis. Different metabolic cells can have different thresholds, at which one metabolic cell will be inhibited, but another one, featuring other physicochemical or physiological-biochemical regulators, will not. The continuity of signal/process transmission from the point of origin to the final recorded point (a flow, a substance, a signal, or a process) is fundamental to percolation systems. With such properties, the flavonoid biosynthesis system can be a fractal system that observes the self-similarity principle for metabolic networks of any size within the hierarchy created by the permissible radical replacements in flavonoid classes. Fractal analysis has a unique feature that enables statistically correct extrapolation of partial data onto the whole. Data analysis thus leads to an assumption that the emergence of individual substances (elution of chromatographic peaks) is a result of the flavonoid and flavonoid-like substance biosynthesis system being fractal.
Flavonoids, free compounds, and their glycosides are released as a result of correctly performed extraction and chromatography. This might also produce impurities of a different nature, e.g. water-soluble molecules with a system of conjugated single or double bonds. In any case, the emergence of any plant-derived biochemical substance registered by the above method is the output of the substrate > enzyme (gene) > product cells as described above. This means the synthesis of this or that flavonoid molecule is a deterministic process. However, the sheer number of endogenous and exogenous factors that affect the synthesis of flavonoids in a chain of metabolic cells effectively creates a randomly heterogeneous medium where single metabolic cells/links of a metabolic system are inhibited and/or activated. Therefore, the preliminary finding is that the diversity of chromatograms resulting from the stochastically regulated synthesis system has fractal properties. Due to this, the fractal properties of chromatograms are the product of the flavonoid/ flavonoid-like substance biosynthesis system being fractal.
Acknowledgment
The chromatographic analysis was carried out on the equipment of the common use center “Chemistry” of UIC of the RAS.
The investigation was sponsored by the RFBR grants 18-44-860006.
References
- Lambers H., Chapin F.S., Pons T.L. 2008. Plant physiological ecology. Springer. 605. ISBN 978-1-4939-3705-9
- Kimura M. 1983. The neutral theory of molecular evolution. Cambridge Uni Press: Cambridge. ISBN 0-521-23109-4. https://doi.org/10.1017/CBO9780511623486
- Hubbell S.P. 2006. Neutral theory and the evolution of ecological equivalence. Ecol. 87: 1387-1398. https://doi.org/10.1890/0012-9658(2006)87[1387:NTATEO]2.0.CO;2
- Dembitsky V.M., Abu-Lafi S., Hanus L.O. 2007. Separation of sulfur-containing fatty acids from garlic Allium sativum, using serially coupled capillary columns with consecutive nonpolar, semipolar and polar stationary phases. Acta Chromatogr. 18: 206-216. http://www.us.edu.pl/uniwersytet/jednostki/wydzialy/chemia/acta/ac19/zrodla/18_AC19.pdf
- Morozov S.V., Chernyak E.I. 2011. Use of chromatographic profiling for analysis and identification of low molecular organic substances of natural and anthropogenic origin. Chem Sustain Devel. 19: 601-617. https://www.sibran.ru/upload/iblock/1f7/1f72efd6a20a350a7a1debf92c795716.pdf
- Rosenberg G.S. 2013. Introduction to the theoretical ecology. Tolyatti. 2.
- Mc Gill. 2010. Towards a unification on unified theories of biodiversity. Ecol Lett. 13: 627-642. https://doi.org/10.1111/j.1461-0248.2010.01449.x
- Gelashvili D.B., Iudin D.I., Rosenberg G.S., Yakimov V.N., Solntsev L.A. 2013. Fractals and multifractals in bioecology. PH NNU, Nizhniy Novgorod. 370.
- Amineva А.А. 2003. Yarrow Achillea asiatica Serg. in the Trans-Urals. Moscow. 17.
- Yanturin S.I., Usmanov I.Yu. 2003. Optimization of the natural complex of the southeast of the Republic of Bashkortostan on the basis of differential conservation of anthropogenic press elements. Izvestiya Samara Scient Ctr Russ Acad Sci. 5: 231-239.
- Usmanov I.Yu., Semenov I.N., Shcherbakov A.V., Suyundukov J.T. 2014. Endemic the ecological niches of the South (Bashkirian) of the TRANS-Urals: A multidimensional and fluctuating modes. Vestnik BSAU. 1: 16-21.
- Abramova L.M., Bashirova R.M., Murtasina F.K., Usmanov I.Yu. 2001. Characteristics of cenopopulations Glycyrrhiza Korshinskyi Grig. in the southeast of the Republic of Bashkortostan. Plant Resour. 37: 24-29.
- Farukshina G.G., Putenihin V.P. 2011. Structure of cenopopulations of Juniperus sabina (Cupressaceae) in the Southern Urals. Russ Bot J. 96: 1108-1121.
- Hubbell S.P. 2001. The unified neutral theory of biodiversity and biogeography (MPB-32). Princeton Uni Press. https://www.jstor.org/stable/j.ctt7rj8w
- Gaston K.J., Choun S.L. 2005. Neutrality and niche. Funct Ecol. 19: 1-6. https://doi.org/10.1111/j.0269-8463.2005.00948.x
- Hlyostkina E.K, Shoeva О.Yu., Gordeeva E.I. 2014. Flavonoid Biosynthesis Genes in Wheat. Vavilov J Genet Breed. 18: 784-796. https://vavilov.elpub.ru/jour/article/view/306
- Korulkin D.Yu., Abilov J.A., Muzychkina R.A., Tolstikov G.A. 2007. Natural flavonoids. Novosibirsk: Theo. 232.
- Petrussa E., Braidot E., Zancani M., Peresson C., Bartolini A., Patui S., Vianello A. 2013. Plant flavonoids-biosynthesis, transport and involvement in stress responses. Int J Mol Sci. 14: 14950-14973. https://doi.org/10.3390/ijms140714950
- Harborne J.B. 2013. The flavonoids: Advances in research since 1980. Springer.
- Zaprometov M.N. 1993. Specialized functions of phenolic compounds in plants. Russ J Plant Physiol. 40: 921-931.
- Middleton E.Jr., Kandaswami C., Theoharides T.C. 2000. The effects of plant flavonoids on mammalian cells: implications for inflammation, heart disease, and cancer. Pharmacol Rev. 52: 673-751. http://pharmrev.aspetjournals.org/content/52/4/673
- Rakhmankulova Z.F., Shuyskaya E.V., Scherbakov A.V., Fedyaev V.V., Biktimerova G.Y., Hafizova R.R., Usmanov I.Yu. 2015. Concentration of proline and flavonoids in shoots of halophytes growing on the territory of the Southern Urals. Russ J Plant Physl. 62: 71-79. https://doi.org/10.1134/S1021443715010112
- Murtasina F.K., Bashirova R.M., Yanturin S.I., Usmanov I.Yu. 2002. The genus licorice Glyzyrrhiza in the Southern Urals. Ufa: BSU. 104.
- Ableeva A.V. 2004. The influence of environmental factors on the productivity and accumulation of secondary metabolites by plants Echinacea purpurea Moench. Tolyatti. 20.
- Scherbakov A.V., Buskunov G.G., Amineva A.A., Ivanov S.P., Usmanov I.Yu. 2009. Variability of secondary metabolite content in Achillea nobilis L. in ecological conditions of the southern Urals. Proceed Samara Scient ctr RAS. 11: 198-204.
- Shcherbakov A.V., Chistyakova M.V., Rakhmankulova Z.F., Usmanov I.Yu. 2012. Physiological aspects of regulation of plasticity of flavonoid accumulation in the southern Urals. Bull Bashkir state Uni. 17: 931-942.
- Shcherbakov A.V. 2013. Plasticity of correlations between the indicators of the main and specialized metabolism of plants as a response to the unpredictability of the habitat. Proceed Samara scient ctr the Russ Acad Sci. 15: 366-371.
- Abu-Lafi S., Dembicki J.W., Goldshlag P., Hanu L., Dembitsky V. 2004. The use of the Cryogenic CG/MS and one column injection for study of organosulfur compounds of the Allium sativum. J Food Compos Anal. 17: 235-245. http://dx.doi.org/10.1016/j.jfca.2003.09.002
- Zhou J., Li Y., Zhao J., Xue X., Wu L., Chen F. 2008. Geographical traceability of propolis by high-performance liquid-chromatography fingerprints. Food Chem. 108: 749-759. https://doi.org/10.1016/j.foodchem.2007.11.009
- Scherbakov A.V., Chistyakova M.V., Aminev G.H., Ivanov S.P., Usmanov I.Yu. 2009. Variability of secondary metabolite content in Juniperus sabina L. in the southern Urals. Bashkir chem J. 16: 132-137.
- Scherbakov A.V., Usmanov I.Yu., Suyundukov Ya.T. 2014. Intrapopulation variability of flavonoid biosynthesis in medicinal plants of the Southern Urals. Izvestiya Samara Scient Ctr Russ Acad Sci. 16: 274-280.
- Shcherbakov A.V., Dautova G.R., Usmanov I.Yu. 2015. Interpopulation variability of flavonoids of chelating complex of licorice Korzhinsky Glycyrrhiza korshinskyi in the southern Ural. Bull Bashkir state Uni. 19: 67-74. http://bulletin-bsu.com/en/archive/2014/1/13/
- Kolchanov N.А., Ignatieva E.V., Podkolodnaya V.A., Likhoshvay V.A. Matushkin Yu.G. 2013. Gene Networks. Russ Vavilov J Genet Select. 17: 833-850. https://vavilov.elpub.ru/jour/article/view/206
- Shuyskaya E., Rakhmankulova Z., Voronin P., Kuznetsova N., Biktimerova G., Usmanov I. 2015. Salt and osmotic stress tolerances of the C3-C4 xero-halophyte Bassia sedoides from two populations differ in productivity and genetic polymorphism. Acta Physiol Plant. 37: 236. https://doi.org/10.1007/s11738-015-1981-x
- Shcherbakov A.V., Chistyakova M.V., Usmanov I.Yu. 2011. Environmental aspects of regulation of plasticity of flavonoid accumulation in the southern Urals. Bull Bashkir State Uni. 16: 1198-1205.
- Shcherbakov A.V., Faizova S.M., Ivanov S.P., Usmanov I.Yu. 2012. Effect of deficiency of individual elements of mineral nutrition on the accumulation of flavonoids by legumes on the example of beans (Phaseolus vulgaris L.). Proceed Samara Scient Ctr RAS. 14: 223-228.