Research Article - Modern Phytomorphology ( 2026) Volume 20, Issue 4
Screening of wheat genotypes and TaSTG gene expression under variable salinity levels
Iqra Aslam1*, Muhammad Kashif1, Zaheer Ahmed1 and Nisar Ahmed22Department of Centre of Agricultural Biochemistry and Biotechnology (CABB), University of Agriculture, Faisalabad, Pakistan
Iqra Aslam, Department of Plant Breeding and Genetics, University of Agriculture, Faisalabad, Pakistan, Email: iqraaslam281@gmail.com
Received: 01-Sep-2026, Manuscript No. mp-26-194407; Accepted: 23-Sep-2026, Pre QC No. mp-26-194407 (PQ); Editor assigned: 03-Sep-2026, Pre QC No. mp-26-194407 (PQ); Reviewed: 21-Sep-2026, QC No. mp-26-194407; Revised: 22-Sep-2026, Manuscript No. mp-26-194407 (R); Published: 30-Sep-2026 , DOI: 10.5281/zenodo.23081141
Abstract
The present study screened one hundred wheat genotypes at the seedling stage under different salinity levels (0, 5, 10, and 15 dS/m NaCl) under laboratory conditions to assess the effects of salinity. The assessment of wheat germplasm for traits such as root length, shoot length, fresh shoot weight, dry shoot weight, fresh root length, and dry root weight revealed substantial variation in salinity tolerance at the seedling stage. The seedling experiment demonstrated that variation in salinity tolerance exists in wheat at the seedling stage and that improvement in salinity tolerance is possible through selection and subsequent hybridization. The experiment was repeated twice under the same laboratory conditions to assess the reproducibility of the results. Principal Component Analysis (PCA) was performed, based on which Durum wheat (TOB-66) and Bread wheat (Blue Silver) were identified as salt-tolerant genotypes because they performed best for most of traits at different salinity levels, whereas STW-118 and Chenab-2000 were identified as salt-susceptible genotypes. Real-time Polymerase Chain Reaction (RT-PCR) was used to detect the expression of the salinity-tolerance gene TaSTG in the selected wheat genotypes. The expression level of TaSTG increased only in salt-tolerant genotypes and not in salt-susceptible genotypes. These findings suggest that TaSTG may be associated with improved salinity tolerance in the selected wheat genotypes and could be useful for further breeding efforts.
Keywords
Wheat, Salinity tolerance, Expression analysis, TaSTG, Real-time Polymerase Chain Reaction (RT-PCR)
Abbreviations
NaCl: Sodium Chloride; PCA: Principal Component Analysis; RT-PCR: Reverse Transcription Polymerase Chain Reaction; ROS: Reactive Oxygen Species; CRD: Completely Randomized Design; SL: Shoot Length; FSW: Fresh Shoot Weight; ANOVA: Analysis of Variance; FRW: Fresh Root Weight; DSW: Dry Shoot Weight; DRW: Dry Root Weight; RL: Root Length; RSR: Root-to-Shoot Ratio; G × T: Genotype × Treatment; PC1: Principal Component 1; PC2: Principal Component 2; RNA: Ribonucleic Acid; mRNA: messenger RNA; cDNA: complementary Deoxyribonucleic Acid; rpm: revolutions per minute; TRIzol: commercial reagent/trade name; RNase: Ribonuclease; DNA: Deoxyribonucleic Acid; PCR: Polymerase Chain Reaction; dNTPs: deoxyribonucleotide triphosphates; Oligo(dT): oligo(deoxythymidine) primer; CT/Ct: Cycle Threshold; CDPK: Calcium-Dependent Protein Kinase; P5CS: Pyrroline-5-Carboxylate Synthetase; P5CR: Pyrroline-5-Carboxylate Reductase
Introduction
In the arid and semi-arid tropics of the world, soil salinity has become a major threat to crop production due to climate change and a shortage of good quality water, which has resulted in the high accumulation of soluble salts, especially NaCl, in the soil (Hussain, et al. 2019, El Sabagh, et al. 2021). Over the past two decades, the climate has changed considerably. Increasing temperatures are leading to greater evaporation of soil moisture and the accumulation of salts in the soil (Masarmi, et al. 2023). Salinity significantly reduces the productivity of wheat crops by affecting their growth and yield (Turki, et al. 2014, Iqbal, et al. 2018). Among various abiotic stresses, salinity stress reduces wheat yield by 54% (Mehmood, et al. 2025). It affects wheat growth in three ways: ionic stress in the cytosol, osmotic stress, and oxidative stress due to the accumulation of Reactive Oxygen Species (ROS). Due to these stresses, plant lose the ability to take up water, causing ion and hormonal imbalances and resulting in a decline in photosynthetic activity and, consequently, a decrease in yield (Hussain, et al. 2019).
The seedling stage is a very important stage and is more sensitive stage to salt stress than the maturity stage. Several seedling attributes, such as root length, shoot length, fresh root weight, fresh shoot weight, dry shoot weight, and dry root weight are affected by salinity stress (Asif, et al. 2020, Hossain et al. 2023). Previous research has shown that genotypes selected as salt-tolerant based on seedling traits also exhibit stress tolerance at maturity. Seedling traits have an effect on the plant life cycle (Ahmed, et al. 2022). Salttolerant genotypes induce defense responses, indicating a functional correlation between salinity tolerance and gene expressi on patterns (Irshad, et al. 2022).
Over the past few decades, many researchers have isolated and characterized a number of salt-responsive genes. One of the genes involved in salinity tolerance is TaSTG, which shows induced expression under salinity stress. It is hypothesized that, besides traditional breeding, the identification and characterization of genes involved in salinity tolerance are fundamental to developing stress-resilient genotypes. Real-time PCR provides precise quantification of gene expression and is used to analyze stress-responsive genes. TaSTG has been associated with osmotic adjustment and ion homeostasis (Wang, et al. 2013).
The main objective of the study was to screen wheat genotypes under different salinity levels at the seedling stage and to analyze the expression pattern of the TaSTG gene in selected wheat genotypes under control conditions and different levels of salinity stress, with the aim of identifying salt-tolerant genotypes for incorporation into future breeding programs.
Materials and Methods
Germplasm and experimental conditions
The wheat germplasm, including varieties, advanced lines, and local landraces, was collected from the Wheat Research Institute (WRI), Faisalabad, and the Department of Plant Breeding and Genetics, University of Agriculture, Faisalabad.
The experiment was conducted in the growth room of the Seed Science and Technology Laboratory, University of Agriculture, Faisalabad, under a CRD with three replicates. Wide Petri dishes were used to determine the responses of the genotypes under different salinity stress levels. Filter paper was cut according to the Petri dish size and placed at the bottom and top of each Petri dish. Ten seeds were placed in each Petri dish on the filter paper. In the first treatment (T0), distilled water was used, whereas for the salt treatments (T1, T2, and T3), solutions were formulated by adding 2.925, 5.85, and 8.78 g of NaCl to 1 L of distilled water to obtain 5, 10, 15 dS/m NaCl solutions, respectively. The pH of the solutions was maintained between 5.5 and 6.5. The salt solutions were sprayed onto the Petri dishes according to the respective treatments until saturation was achieved, and spraying was continued at 6-h intervals. To assess data reproducibility and obtain more reliable results, the experiments were repeated twice under the same environmental conditions.
Data recorded on root and shoot traits
After 14 days of seed placement, three seedlings of each genotype from each replication were randomly selected, and root length (cm) and shoot length (cm) were recorded. Fresh root and shoot weights were measured in grams (g) using an electronic balance (Shimadzu model). After recording the fresh weights of the root and shoots, the samples were dried in an oven at 70â°C for 48 h, and dry shoot weight and dry root weight were measured in grams (g) using an electronic balance.
Statistical analysis
The collected data were subjected to Principal Component Analysis (PCA) using XLSTAT (2014) software and were statistically analyzed using a factorial experiment in a split-plot design under a CRD (Gomez and Gomez, 1983).
Expression analysis
In this study, four genotypes (two salt-tolerant and two salt-sensitive) were selected based on the interpretation of Principal Component Analysis (PCA) and analyzed using real-time PCR (RT-PCR) to determine the relative expression of the candidate gene TaSTG.
Growing of wheat nursery
The experiment was conducted using a CRD with three replicates. Fifteen seeds were sown in each pot at a depth of 1 cm, with each pot containing 450 g of sand. For irrigation, a half-strength Hoagland nutrient solution without added salt was used as T0, whereas nutrient solutions containing three salt concentrations, T1 (100 mM), T2 (150 mM), and T3 (200 mM), were prepared by the adding 5.85, 8.775, and 11.7 g/L NaCl, respectively. The pH of the solutions was maintained between 5.5 and 6.5. After sowing, each experimental unit was irrigated with 90 mL of the assigned treatment solution. A total of two irrigations were applied during the experimental period at a 12-day interval. The seedlings were harvested 30 days after of sowing. Shoot sample were then collected for RNA extraction.
Isolation of mRNA and cDNA synthesis
The workbench was properly sterilized was a 75% ethanol solution. All equipment was autoclaved before use. Samples were carefully ground under liquid nitrogen and immediately mixed with 700 μL of TRIzol in Eppendorf tubes. A centrifuge (thermo scientific) was set to 4ºC. All samples were centrifuged at 12,000 rpm for 5 minutes. The supernatant was transferred using a pipette into new eppendorf tubes and incubated on ice for 5 minutes. The supernatant was transferred using a pipette into another autoclaved eppendorf tube and incubated on ice for 5 minutes. After adding 200 μL of chloroform to each sample, the tubes containing the supernatant were centrifuge at 12,000 rpm for 15 minutes. The aqueous phase was carefully transferred to new Eppendorf tubes, mixed with 500 μL of isopropanol, and incubated for 10 minutes. The supernatant was then discarded. The RNA pellets were washed with 1,000 μL of 75% ethanol. The sample were then centrifuged again for 5 minutes at 7,500 rpm. The ethanol was discarded, and the RNA pellet was dissolved in 20 μL of RNAasefree water and stored at -80ºC overnight. The following day, RNA concentration was quantified using a Nanodrop 8000 Spectrophotometer (thermo scientific). cDNA was synthesized from the isolated RNA of each sample using the thermo scientific RevertedAid kit (K1622;100 reactions). In autoclaved PCR tubes, 1 μL of Oligo (dT) primer, 0.1-5 μL of diluted RNA, and nuclease-free water were added to make a final volume of 12 μL. The tubes were incubated in a thermocycler for 5 minutes at 65ºC. After that, 4 μL of reaction buffer, 2 μL of dNTPs, 1 μL of reverse transcriptase, and 0.5 μL of RNase inhibitor were added to the previously incubated samples (12 μL) to make a final volume of 20 μL. This reaction mixture was incubated in a thermocycler for 80 minutes at 42ºC, followed by 5 minutes at 70ºC, and the reaction was then terminated at 4ºC.
RT-PCR
For RT-PCR, 12.5μL of thermo scientific maxima SYBR green master mix was used. To prepare the PCR reaction mixture, the previously prepared and stored cDNA was thawed and briefly centrifuged. Subsequently, 1 μL of cDNA containing less than 500 ng was added to the master mix. Both forward and reverse primers of the candidate genes were added at a concentration of 0.5 μM each. Finally, the reaction volume was adjusted to 20 μL with nuclease-free water. All steps were performed at room temperature.
TaSTG (the candidate gene) and Actin (the housekeeping gene) were amplified using specific primers listed in Tab. 1. The relative expression of the candidate gene was calculated using the 2-ΔΔCT method described by Livak and sachmittgen, 2001 and Schmittgen and Livak, 2008.
| Gene | Primer sequences | Reference |
|---|---|---|
| TaSTG | 5'-CGAGCGTGCCAACTGGGTG-3' | Wang, et al. 2013 |
| 5'-GACGACGAGGAGCACGAAGATG-3' | ||
| Actin | 5'-AGGCACCTCTTAACCCTAAAGC-3' | |
| 5'-GGACAACGGAATCTCTCAGC-3' |
Table 1. The primers of RT-PCR.
Results
Genetic variation is essential for the breeding of salt-tolerant wheat lines. A factorial experiment in a split-plot design under CRD was used to evaluate 100 genotypes under three salinity levels and a control treatment for a period of two years, with years considered as the main-plot factor, whereas salinity and genotypes assign to the subplots in factorial arrangement. Analysis of Variance (ANOVA) was performed on all seven numerically recorded variables, and the results are presented in Tab. 2. The analysis of variance demonstrated that year-wise differences were significant for five traits, i.e., SL, FSW, FRW, DSW, and DRW, but non-significant for RL and RSR. Highly significant differences were reported for all measured traits among for genotypes, treatments, and their interaction, indicating changes in genotypes performance in response to different treatments. The interaction of year with genotype, treatment, and Genotype × Treatment (G × T) were highly significant.
| SOV | df | SL | RL | RSR | FSW | FRW | DSW | DRW |
|---|---|---|---|---|---|---|---|---|
| Main plot factor Years (Y) | 1 | 1642.516* | 280.508ns | 4.596ns | 0.568** | 0.065** | 0.564** | 0.421** |
| Error (a) | 4 | 96.474 | 66.442 | 3.755 | 0.011 | 0.003 | 0.003 | 0.002 |
| Subplot factor | 399 | 44.764** | 57.438** | 2.84** | 0.062** | 0.004** | 0.014** | 0.011** |
| Treatment (T) | 3 | 1163.88** | 1709.594** | 14.862** | 0.232** | 0.068** | 0.291** | 0.287** |
| Genotypes (G) | 99 | 52.01** | 49.179** | 3.023** | 0.07** | 0.005** | 0.017** | 0.012** |
| T × G | 297 | 31.045** | 43.503** | 2.658** | 0.057** | 0.003** | 0.011** | 0.009** |
| Main plot factor × subplot factor | 399 | 38.913** | 49.479** | 2.988** | 0.064** | 0.003** | 0.014** | 0.012** |
| Y × S | 3 | 667.489** | 208.431** | 5.694** | 0.286** | 0.026** | 0.322** | 0.348** |
| Y × G | 99 | 53.291** | 52.049** | 4.405** | 0.081** | 0.004** | 0.016** | 0.011** |
| Y × S × G | 297 | 27.771** | 47.016** | 2.488** | 0.057** | 0.003** | 0.011** | 0.009** |
| Error (b) | 1596 | |||||||
| Total | 2399 |
N ote: *, **=Significant at 5% and 1% probability level respectively. SOV: Source of Variation, df: degrees of freedom; SL: Shoot Length, RL: Root Length, RSR: Root-to-Shoot Ratio, FSW: Fresh Shoot Weight, FRW: Fresh Root Weight, DSW: Dry Shoot Weight, DRW: Dry Root Weight
Table 2. Mean square values of ANOVA for factorial experiment in split plot design under CRD for various seedling traits.
Biplot analysis
Principal Component Analysis (PCA) biplots of 100 genotypes and seven variables for 2017 and 2018 at the seedling stage were generated, and different patterns of variability among the traits were observed (Figs. 1 and 2). The relative length of a vector in the biplot denotes the relative magnitude of variability associated with each variable. The position of each variable with respect to PC1 and PC2 indicated its contribution to the variation observed in the germplasm. The traits evaluated were RL, SL, RSR, FRW, FSW, DRW, and DSW. PCA of one hundred wheat genotypes under the control and three salinity levels was performed. To assess data reproducibility and obtain more reliable results, the seedling experiment was repeated in the growth room, and the data from both years were separately subjected to PCA to select salt-tolerant and salt-susceptible genotypes. The greater the length of the vector, the greater the variability associated with that trait. The closer the vectors, the stronger the correlation between the corresponding traits. On average, genotypes that were positioned away from the origin and performed well for most traits were selected. A cluster of genotypes indicates that they have similar multivariate performance. On average, genotype 14 (TOB-66) and 22 (Blue Silver) were selected as salt-tolerant because they performed well for most traits at different salinity levels, whereas genotype 57 (Chenab-2000) and genotype 60 (STW-118) were selected as salt-susceptible based on the results from both years.
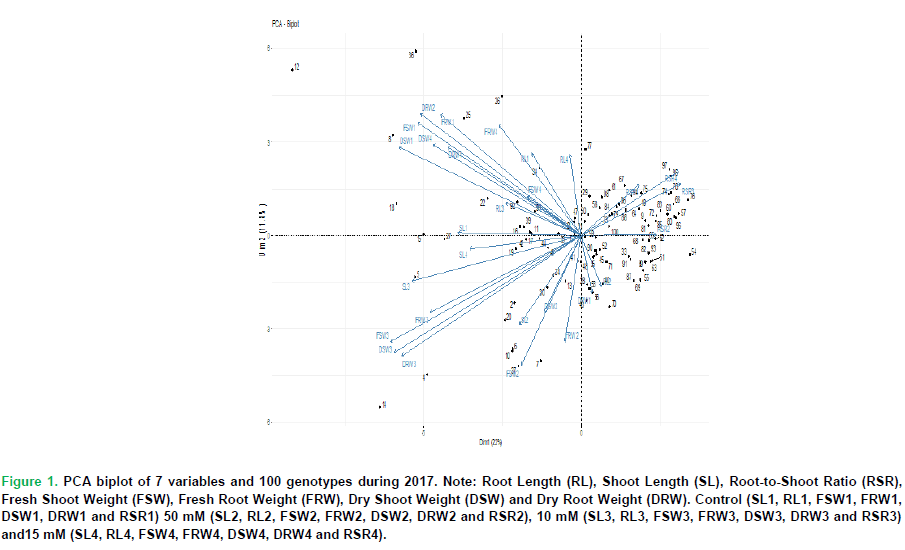
Figure 1: PCA biplot of 7 variables and 100 genotypes during 2017. Note: Root Length (RL), Shoot Length (SL), Root-to-Shoot Ratio (RSR), Fresh Shoot Weight (FSW), Fresh Root Weight (FRW), Dry Shoot Weight (DSW) and Dry Root Weight (DRW). Control (SL1, RL1, FSW1, FRW1, DSW1, DRW1 and RSR1) 50 mM (SL2, RL2, FSW2, FRW2, DSW2, DRW2 and RSR2), 10 mM (SL3, RL3, FSW3, FRW3, DSW3, DRW3 and RSR3) and15 mM (SL4, RL4, FSW4, FRW4, DSW4, DRW4 and RSR4).
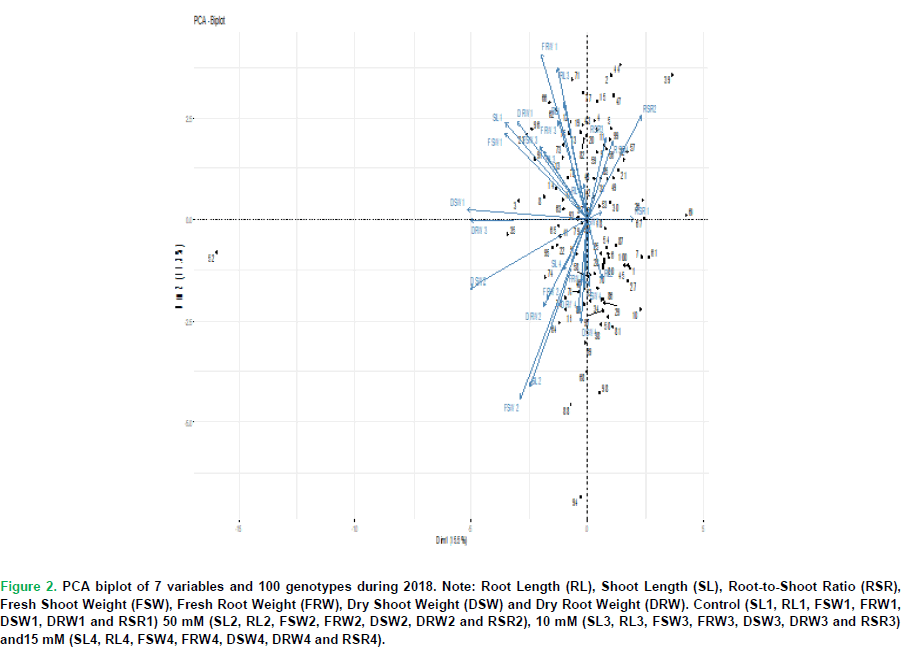
Figure 2: PCA biplot of 7 variables and 100 genotypes during 2018. Note: Root Length (RL), Shoot Length (SL), Root-to-Shoot Ratio (RSR), Fresh Shoot Weight (FSW), Fresh Root Weight (FRW), Dry Shoot Weight (DSW) and Dry Root Weight (DRW). Control (SL1, RL1, FSW1, FRW1, DSW1, DRW1 and RSR1) 50 mM (SL2, RL2, FSW2, FRW2, DSW2, DRW2 and RSR2), 10 mM (SL3, RL3, FSW3, FRW3, DSW3, DRW3 and RSR3) and15 mM (SL4, RL4, FSW4, FRW4, DSW4, DRW4 and RSR4).
Expression analysis
The bar graph showed a non-linear expression pattern in genotypes STW-118 and Chenab-2000, characterized by upregulation under the control condition, downregulation at 100 mM salt stress, upregulation at 150 mM of salt stress, and subsequent downregulation at 200 mM salt stress, although expression remained lower than that under the control condition. The candidate gene showed a biphasic expression pattern in response to increasing salinity in genotypes Blue Silver and TOB-66. Expression was strongly induced at 100 mM, decreased at 150 mM, and increased again at 200 mM, although the expression level remained lower than that observed at 100 mM (Fig. 3).
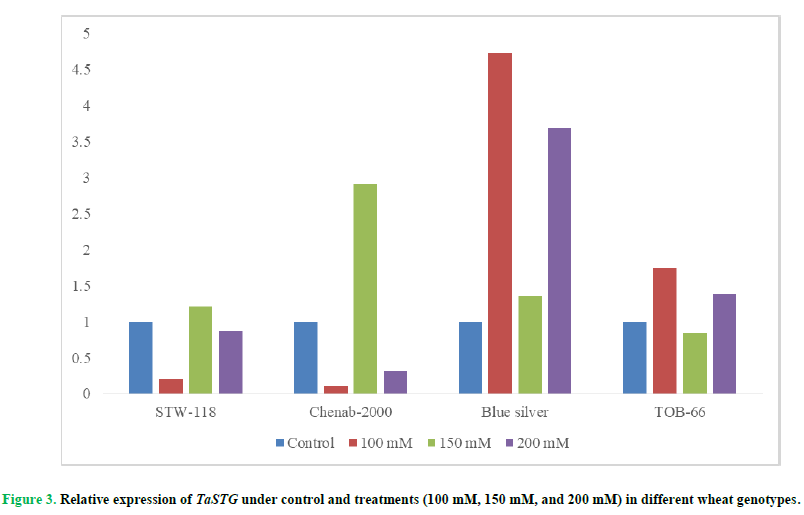
Figure 3: Relative expression of TaSTG under control and treatments (100 mM, 150 mM, and 200 mM) in different wheat genotypes.
Discussion
Salinity is a major abiotic stress affecting the productivity and growth of wheat (Sairam, et al. 2002). Plant breeders have developed crop varieties adapted to specific geographic regions that tolerate certain abiotic and biotic stresses (Nakashima, et al. 2000). Evaluation of germplasm under salinity stress conditions is crucial for developing salt-tolerant crops. The stability and desirable responses of genotypes across different environments are very important for plant breeders to obtain more reliable results.
Over the years, many researchers have evaluated different wheat germplasm materials based on seedling traits. These attributes have been useful for distinguishing salt-tolerant genotypes from salt-susceptible genotypes and have revealed highly significant differences among genotypes and treatments for all the attributes. In the current study, the year effect was non-significant for root length and the root-to-shoot ratio. The genotype × treatment, year × genotype, year × treatment, and year × genotype × treatment interactions were highly significant for all the traits. It was concluded that increasing salinity significantly affected the fresh shoot weight and dry shoot weight. The current study findings are consistent with those of Al Ashkar and El Kafafi, 2014, who reported highly significant differences among genotypes under two NaCl levels, indicating the presence of genetic variation.
A total of 100 genotypes were screened under different salinity stress levels. The results showed that seedling traits varied significantly under salinity stress. Shoot length, root length, dry shoot weight, and dry root weight were reduced under different salinity stress levels. Shoot and root lengths were strongly affected by salt stress. At the seedling stage, dry weight of roots and shoots was used as a selection criterion under salt stress. It is suggested that the proportion of biomass under salt stress relative to the control treatment can be used to assess salinity tolerance. Biomass is an important trait because it correlates with grain yield (Munn, 2002). Turki, et al. 2014 reported that 36 varieties selected on the basis of seedling-stage performance performed well under saline field conditions and produced grain yield. The present results also showed that, at the seedling stage, shoot length, fresh shoot weight, and dry shoot weight were affected by 100 mM NaCl. The selected salt-tolerant and salt-susceptible genotypes were further evaluated under saline field conditions. Results showed that salttolerant varieties developed biomass under saline field conditions, whereas salt-susceptible genotypes produced less biomass. The seedling stage is an important stage and is highly sensitive to salt stress. A study showed that growth parameters, such as shoot fresh weight, and dry weight are important for screening wheat germplasm at the seedling stage (Xu, et al. 2024).
PCA and selection of genotypes
Principal Component Analysis (PCA) is a multivariate data analysis technique that showed that fresh and dry weights of seedlings are important traits associated with salinity tolerance. These attributes contributed substantially to the variation in the responses of the 100 genotypes to salinity. It is also suggested that, in addition to higher fresh and dry weights, longer root and shoot lengths may be important criteria for selecting salinity-tolerant genotypes. Seedling experiments are of short duration, feasible, relatively less labor-intensive, and capable of providing reproducible results (Dasgan, et al. 2002). Field evaluation of wheat genotypes for salinity tolerance is difficult because of high soil heterogeneity, which makes it challenging to identify genotypic variation. Therefore, under field conditions, it is critical to account for environmental variation when evaluating genotypes. Field conditions vary considerably among locations with respect to the physical and chemical properties of the soil (Delgado and Gomez, 2024). Therefore, it is important to select genotypes on the seedling stage, followed by molecular validation through RT-PCR.
TaSTG expression
In a previous study, Wang, et al. 2013 identified the TaSTG gene in the salt-tolerant wheat mutant (RH8706-49). TaSTG was a demonstrated causal regulatory role. Unless the present or cited study experimentally established this mechanism, was suggested highly expressed in salt-tolerant genotypes and was suggested to be involved in regulating plant responses to osmotic stress. TaSTG exhibited a similar expression pattern in genotypes STW-118 and Chenab-2000 across the salinity treatments. In genotypes STW-118 and Chenab-2000, TaSTG expression increased at 150 mM salinity, showing approximately 1.2-fold and 2.9-fold increases, respectively, indicating possible activation of the gene in response to moderate salinity stress. However, at 200 mM, their expression decreased to 0.87-fold and 0.32-fold of the control. This reduction may be attributed to transcriptional repression or impairment of cellular metabolic process caused by excessive salinity stress. The non-linear expression pattern of the gene suggest that candidate gene differentially regulate depending upon the severity of stress. This pattern is consistent with previous studies of relative expression of genes TaSOS2 and TaSOS3 during salinity stress (Gholizadeh, et al. 2026).
In Blue Silver and TOB-66 candidate gene up-regulated in 200 mM (3.7-fold and 1.4-fold respectively) salt level whereas downregulated in control, suggesting it could be used in breeding program as it tolerates salt stress. Present results are in accordance with Wang et al., 2013. According to them, TaSTG was highly expressed in salt-tolerant genotypes as compared to salt-sensitive genotypes suggesting it might be closely related to salt tolerance. TaSTG may act upstream of the upregulated genes by regulating plant response to osmotic stress through CDPK and phospholipase pathway by enhancing plant salt stress through more proline. The increase in proline accumulation was due to upregulation of genes P5CS and P5CR, along with the downregulation of PHD (Tavakoli, et al. 2016). Therefore, these studies are of significant importance in this field of research, as they aim to mitigate the adverse effect of salinity stress.
Conclusion
From the present studies, it is suggested that wheat genotypes Blue Silver and TOB-66 performed well under varying salinity levels at the seedling stage. TaSTG gene gave moderate to high amount of expression under high salinity stress (200 mM) for genotypes STW-118, Blue Silver, and TOB-66. Therefore, this gene could be used as a salt-tolerant marker for future wheat breeding programs.References
- Ahmed HG, Zeng Y, Raza H, Muhammad D, Iqbal M, Uzair M, Khan MA, Iqbal R, El Sabagh A. (2022). Characterization of wheat (Triticum aestivum L.) accessions using morpho-physiological traits under varying levels of salinity stress at seedling stage. Front Plant Sci. 13:953670.
[Crossref] [Google Scholar] [PubMed]
- Al-Ashkar IM, El-Kafafi SH. (2014). Identification of traits contributing salt tolerance in some doubled haploid wheat lines at seedling stage. Middle East J Appl Sci. 4:1130-1140.
- Asif S, Ali Q, Malik A. (2020). Evaluation of salt and heavy metal stress for seedling traits in wheat. Biol Clin Sci Res J. 2020:e005.
- Dasgan HY, Aktas H, Abak K, Cakmak I. (2002). Determination of screening techniques to salinity tolerance in tomatoes and investigation of genotype responses. Plant Sci. 163:695-703.
- Delgado A, Gómez JA. (2024). The soil: Physical, chemical, and biological properties. In: Principles of Agronomy for Sustainable Agriculture. Cham: Springer International Publishing. p. 15-30.
- El Sabagh A, Islam MS, Skalicky M, Ali Raza M, Singh K, Anwar Hossain M, Hossain A, Mahboob W, Iqbal MA, Ratnasekera D, Singhal RK. (2021). Salinity stress in wheat (Triticum aestivum L.) in the changing climate: Adaptation and management strategies. Front Agron. 3:661932.
- Gholizadeh F, Janda T, Varga B, György M, Molnár I, Kruppa K, Türkösi E. (2026). Genotype-dependent salt tolerance mechanisms in wheat-Thinopyrum introgression lines revealed by ion transporter gene expression and seedling phenotyping. Sci Rep. 16:7647.
- Gomez KA, Gomez AA. (1983). Statistical Procedures for Agricultural Research. 2nd ed. New York: An International Rice Research Institute Book.
- Hossain MS, Sultana MS, Naher MN, Hoque MR. (2023). Impact of salinity on seed germination and seedling growth of wheat. J Sci Technol. 1:9.
- Hussain S, Shaukat M, Ashraf M, Zhu C, Jin Q, Zhang J. (2019). Salinity stress in arid and semi-arid climates: Effects and management in field crops. In: Hussain S. (ed.), Climate Change and Agriculture. IntechOpen. p. 1-26.
- Iqbal M, Irshad S, Nadeem M, Fatima T, Itrat AB. (2018). Salinity effects on wheat (Triticum aestivum L.) characteristics: A review article. Int J Agric Biol. 12:1-5.
- Irshad A, Ahmed RI, Ur Rehman S, Sun G, Ahmad F, Sher MA, Aslam MZ, Hassan MM, Qari SH, Aziz MK, Khan Z. (2022). Characterization of salt tolerant wheat genotypes by using morpho-physiological, biochemical, and molecular analysis. Front Plant Sci. 13:956298.
[Crossref] [Google Scholar] [PubMed]
- Livak KJ, Schmittgen TD. (2001). Analysis of relative gene expression data using real-time quantitative PCR and the 2-ΔΔCT method. Methods. 25:402-408.
[Crossref] [Google Scholar] [PubMed]
- Masarmi AG, Solouki M, Fakheri B, Kalaji HM, Mahgdingad N, Golkari S, TelesiÅski A, Lamlom SF, Kociel H, Yousef AF. (2023). Comparing the salinity tolerance of twenty different wheat genotypes on the basis of their physiological and biochemical parameters under NaCl stress. PLoS One. 18:e0282606.
[Crossref] [Google Scholar] [PubMed]
- Mehmood M, Khan ZA, Mehmood A, Zaynab M, Al-Sadoon MK, Harshini M, Wong LS. (2025). Impact of drought, salinity, and waterlogging on wheat: Physiological, biochemical responses, and yield implications. Phyton. 94.
- Munns R. (2002). Comparative physiology of salt and water stress. Plant Cell Environ. 28:239-250.
[Crossref] [Google Scholar] [PubMed]
- Nakashima K, Shinwari ZK, Miura S, Sakuma Y, Seki M, Yamaguchi-Shinozaki K, Shinozaki K. (2000). Structural organization, expression and promoter activity of an Arabidopsis gene family encoding DRE/CRT binding proteins involved in dehydration-and high salinity responsive gene expression. Plant Mol Biol. 42:657-665.
[Crossref] [Google Scholar] [PubMed]
- Sairam RK, Rao KV, Srivastava GC. (2002). Differential response of wheat genotypes to long term salinity stress in relation to oxidative stress, antioxidant activity and osmolyte concentration. Plant Sci. 163:1037-1046.
- Schmittgen TD, Livak KJ. (2008). Analyzing real-time PCR data by the comparative C(T) method. Nat Protoc. 3:1101-1108.
- Tavakoli M, Poustini K, Alizadeh H. (2016). Proline accumulation and related genes in wheat leaves under salinity stress. J Agric Sci Technol. 18:707-716.
- Turki N, Shehzad T, Harrabi M, Tarchi M, Okuno K. (2014). Variation in response to salt stress at seedling and maturity stages among durum wheat varieties. J Arid Land Stud. 24:261-264.
- Wang L, He X, Guo J, Shen Y, Huang Z. (2013). The expression of wheat TaSTG gene can enhance salt tolerance in plants. Plant Biosyst. 147:451-458.
- Xu Y, Weng X, Jiang L, Huang Y, Wu H, Wang K, Li K, Guo X, Zhu G, Zhou G. (2024). Screening and evaluation of salt-tolerant wheat germplasm based on the main morphological indices at the germination and seedling stages. Plants. 13:3201.