Research Article - Modern Phytomorphology ( 2026) Volume 20, Issue 2
Genomewide Association Study (GWAS) for agronomic traits in Pakistani rice germplasm using 10K SNP data
Muhammad Jamil1, Muhammad. Ashfaq1*, Qurban Ali1, Muhammad Ali2 and Adnan Shakir12Department of Entomology, Faculty of Agricultural Sciences, University of the Punjab, Lahore, Pakistan
Muhammad. Ashfaq, Department of Plant Breeding and Genetics, Faculty of Agricultural Sciences, University of the Punjab, Lahore, Pakistan, Email: ashfaq.iags@pu.edu.pk
Received: 20-Mar-2026, Manuscript No. mp-26-186664; Accepted: 22-Apr-2026, Pre QC No. mp-26-186664 (PQ); Editor assigned: 23-Mar-2026, Pre QC No. mp-26-186664 (PQ); Reviewed: 06-Apr-2026, QC No. mp-26-186664; Revised: 13-Apr-2026, Manuscript No. mp-26-186664 (R); Published: 23-Apr-2026 , DOI: 10.5281/zenodo.20411030
Abstract
Rice (Oryza sativa L.) is a critical global staple, essential for food security, especially in Asia. With increasing population pressure and environmental constraints, enhancing yield and agronomic performance through advanced breeding strategies is imperative. This study aimed to assess genetic diversity, identify genomic regions associated with yield-related traits in rice germplasm to facilitate marker-assisted selection and hybrid breeding. A panel of 101 diverse rice genotypes was evaluated over two growing seasons for 11 morphological and yield-related traits, including Association mapping using 10K SNP array identified 129 Marker-Trait Associations (MTAs) across the rice genome, with Phenotypic Variance Explained (PVE) ranging from 6.08% to 27.15%. Several pleiotropic loci influencing multiple traits were detected, such as RM5951 on chromosome 4 linked to plant height, 1000-grain weight, tillers per plant, yield per hectare, and seed setting percentage. These findings provide a foundation for developing high-yielding, climate-resilient rice varieties to meet future food demands. Future work should expand the germplasm base, integrate multi-omics approaches, and promote collaborative efforts for the rapid development and dissemination of improved rice cultivars.
Keywords
Oryza sativa, SNP, Genomic regions, Hybrids, Grain yield
Introduction
Oryza sativa L. is a member of the Poaceae (Gramineae) family. More than 50% of the people in the world is anticipated to be fed by rice, which also provides more than 20% of their daily needs (FAO, 2024). In Pakistan, rice is a staple cuisine. It increased the value of agriculture by 3.0% and the GDP by 0.6%. After wheat, it is our nation’s second-most important crop. The rice crop area grew by 3.8 percent in 2025-2026. Production is 4.0 thousand tonnes above the seven million tonne objective and continues to fall 3.8 percent to 4.1 thousand tonnes from the previous year. Rice is one of the best cereal crop for molecular and genome study because rice have small genome size (˜430Mb) (Wijerathna-Yapa, et al. 2024, Yuan, et al. 2015, Ishtiaq, et al. 2019, Javed, et al. 2024, Abbas, et al. 2024). Mutation, recombination, and unsystematic genetic drift are the causes of genomic diversity in crop populations (Farooq, et al. 2024, Gartner, et al. 2009). Genome-Wide Association Study (GWAS) also called Linkage Disequilibrium (LD) mapping, is regarded as a powerful method for identifying genes (Huang, et al. 2010). To pick out and capitalize on useful allelic variations for crop improvement, herbal diversity is employed (Zhao, et al. 2011).
Materials and Methods
The practice of sowing all genotypes in small polythene bags in the research area of the Department of Plant Breeding and Genetics Faculty of Agricultural Sciences, University of the Punjab.
Phenotyping
Plant height (cm): When the plants were fully grown, the height of five chosen plants was measured from the tip of the central stem to the end of the shoot.
Days to heading (50%): For each variety, the total number of days from transplanting until half of the plants in a plot flowered was noted as Days to 50% Flowering (DF).
Days of maturity: For each variety, days to maturity was calculated as the total number of days from transplanting to plant harvesting in a plot.
Panicle length (cm): Three mature panicles were removed from the selected plants, and their length was measured as the distance between the neck and tip of each panicle.
Number of spikelets per panicle: The number of spikelets per panicle was measured by counting all spikelets on the main panicle of each sampled plant at maturity.
Unfilled spikelets/panicle: Unfilled grain per panicle was determined by counting the amount of unfilled grain from a chosen panicle.
Yield per plant: Yield per plant was measured by harvesting and weighing the total produce from individual plants to determine the average yield for each plant.
1000 grain weight (g): After being removed from the sample, the seeds were weighed as 1000 seeds.
Statistical data analysis
The experiment was conducted using a Randomized Complete Block Design (RCBD) with three replications. Each inbred line was sown on the lines of 9 inches length, and a plant was 9 inches apart. Collected data was analyzed using ANOVA for variance (Steel, et al. 1997).
Statistical analysis: The Least Significant Difference test (LSD) was used to separate means and analyze variances. A 5% probability level was used for statistical analysis of all the data. Statistics 8.1 was used for statistical analysis.
DNA extraction: For Deoxyribonucleic Acid (DNA) extraction, Fresh leaf samples of 20 days old rice lines will be collected and stored at -40°C. A Cetyltrimethylammonium Bromide (CTAB) method (Murray and Thompson, 1980) used for DNA extraction. DNA quality and quantity will be checked through running DNA sample (15 ng) in agarose gel (0.8%). The DNA samples showing smear in the gel under UV light were ignored, and DNA extraction was done again. After DNA extraction, Polymerase Chain Reaction (PCR) will be performed to evaluate the genetic diversity at the gene level. It will be done using SSR (Simple Sequence Repeats).
Genotyping of progenies
Rice genotyping for 10K SNP array: Genomic DNA was extracted using the CTAB method and analyzed with a 1.2k multiplex- PCR panel on the MolBreeding GBTS platform. SNP positions were mapped against physical chromosome distances using the Nipponbare reference sequence. To ensure data quality, researchers filtered out ambiguous SNPs and monomorphic markers with over 20% missing values. Additionally, any minor alleles with a frequency of less than 5% were excluded from the final study.
GWAS analysis for 10K SNP: To assess the findings were credible, researchers used the Genome Association and Prediction Integrated Tool (GAPIT) R package, a computationally efficient tool known for its high likelihood accuracy. The analysis employed non-traditional statistical methods, specifically Compressed Mixed Linear Models (CMLM) for genomic prediction. To prevent false results from population structure, researchers used Principal Components (PCs) as constant effects and a kinship matrix to account for individual relationships. Following the criteria of Sukumaran, et al. 2015, markers were deemed relevant based on specific descriptive thresholds. Ultimately, 7,550 polymorphic SNPs were mapped to established genetic data to complete the GWAS profile.
Results and Discussion
Significant variations between the genotypes for the yield and yield-related variables were revealed by the Analysis Of Variance (ANOVA). In rice germplasm, the traits Days to 50 percent Flowering (DF) and Days to Maturity (DM) demonstrated substantial variances, while the remaining traits indicated extremely significant differences. This suggested that all accessions had a high degree of phenotypic diversity for the parameters under study in the field. Based on examined qualities, the presence of differences in germplasm can help determine whether these variations are genetic or environmental (Suvi, et al. 2020, Thakur, et al. 20211, Upadhyay, et al. 2011). Therefore, choosing the optimal yield requires knowledge of genetic variants and careful analysis of the relationship between yield and other relevant criteria pertaining to the germplasm under study. Breeding efforts for crop development depend heavily on the diversity of germplasm resulting from genetic mechanisms. ANOVA results from the current experiment showed a highly significant difference across rice accessions for the parameters under study, indicating a great deal of genetic variation.
Mean variability
Days to 50 percent Flowering (DF): Among the rice genotypes, average Days to 50 percent Flowering (DF) was 82.49.
Days to Maturity (DM): The average number of DM for each of the 101 rice genotypes was 110.64 (Tab. 1). While G68 and G72 has early maturity, G36, G59, and G79 matured later.
Plant Height (PH): The average plant height for all genotypes was 123.62 cm. Genotypes G72 and G87 were dwarf, whereas G58 and G79 were taller.
No. of Tillers per Plant (T/P): Genotypes under study, the average number T/P was 13.40 (Tab. 1). Genotypes G13 and G72 had more and less tillers, respectively.
Panicle Length (PL): The average Panicle Length (PL) for all rice genotypes under study was 24.83 cm. Genotype with the highest PL is G69.
No. of Grains per Panicle (G/P): Number of Grains per Panicle (G/P), among the 100 rice genotypes, was 147.21 grains (Tab. 1). The genotype with the highest G/P G67.
No. of Unfilled Grains per Panicle (UG/P): The average values for this attribute were 23.32 for all genotypes. The genotype G96 was found to have more UG/P, whereas the genotype G76 exhibited less UG/P.
Seed Setting percentage (SS): Among the rice genotypes under study, the mean values for Seed Setting percentage (SS) were 86.56. Genotypes G13 and G68 had higher and lower levels of SS, respectively.
1000 Grain Weight (TGW): The 1000 Grain Weight (TGW) of the 100 rice genotypes was found to be considerably averaged at 26.95 g.
Yield per Plot (Y/P): The mean values for this characteristic were 3.27 kg for all genotypes. Genotypes, G83 was shown the higher yields, whereas G64 had the lowest yield in both seasons.
Yields per hectare (Y/H): Among the rice accessions under study, the average Yield per Hectare (Y/H) was 2405.03 kg. In this germplasm, the genotype G68 has the lowest yield per hectare in both seasons, while the genotype G10 has the highest Y/H.
GWS-mapping using 10k SNP array
In order to find SNPs associated with yield and other agronomic variables, 7550 high-density, polymorphic SNP markers from the 10K SNP array were examined (Verma, et al. 2019, Wen, et al. 2009, Wang, et al. 2014). This work aimed to discover Quantitative Trait Loci (QTLs) for yield, yield related traits in 101 rice diverse germplasm and to assess the GS (genetic structure) and degree of LD in the rice germplasm. The two years 2016-17 and 2017-18 were used for the phenotypic assessment of yield and agronomic traits. Using a 10k SNP array and the R tool GAPIT, mean values for each characteristic were extracted from the data from utilized for GWAS analysis. Fig. 1 describes the LD patterns of SNPs markers on chromosomes. For pairwise markers, linkage disequilibrium is calculated as R square and plotted versus distance (Fig. 2). Tab. 1 displays all of the GWAS or association mapping results. Using a Mixed Linear Model (MLM) for eleven yield and other agronomic characteristics, 147 significant SNPs were linked to the examined traits at or above the -log 10 (P<0.0001; Tab. 2). Manhattan plots (Fig. 2) that display the locations of significant SNPs and -log10 (p) linked to variables related to yield and drought in both scenarios. The significance level (P<0.0001) is indicated by the blue horizontal line. In the Quantile-Quantile (QQ) plot, the observed negative base-10 logarithm of the P-values is shown by the Y-axis, while the predicted negative base-10 logarithms of the P-values, assuming a uniform [0,1] distribution, are represented by the X-axis. As stated in figures 4.8b-4.18b, the dotted lines in this plot represent the 95% confidence interval for the QQ-plot under the null hypothesis of no connection between the SNP and the examined attributes. Among the traits examined in this study, the total phenotypic variability was reflected by R2 showed in Tab. 2.
| Genotypes | DF | DM | PH | TP | PL | G/P | UG/P | SS | TGW | Y/P | Y/H |
|---|---|---|---|---|---|---|---|---|---|---|---|
| G1 | 83.0 | 110.0 | 132.60 | 12.40 | 23.67 | 168.90 | 11.23 | 93.68 | 28.18 | 2.98 | 2980.0 |
| G2 | 81.0 | 110.3 | 126.27 | 17.00 | 23.73 | 130.67 | 17.17 | 88.64 | 28.30 | 3.06 | 3063.3 |
| G3 | 80.3 | 107.7 | 122.33 | 19.23 | 24.47 | 141.00 | 20.33 | 87.78 | 29.42 | 3.05 | 3050.0 |
| G4 | 82.0 | 108.3 | 119.83 | 19.87 | 23.67 | 138.43 | 15.10 | 90.55 | 28.24 | 3.41 | 3410.0 |
| G5 | 81.0 | 111.3 | 129.47 | 15.77 | 24.97 | 145.53 | 18.60 | 89.30 | 29.84 | 3.40 | 3400.0 |
| G6 | 81.0 | 110.7 | 130.73 | 13.87 | 24.07 | 153.80 | 12.77 | 92.43 | 32.10 | 3.66 | 3656.7 |
| G7 | 83.0 | 112.0 | 130.53 | 17.13 | 25.83 | 180.60 | 24.20 | 88.42 | 30.88 | 3.37 | 3366.7 |
| G8 | 83.7 | 111.3 | 131.07 | 17.40 | 23.27 | 145.93 | 15.97 | 90.09 | 28.87 | 2.91 | 2910.0 |
| G9 | 83.3 | 112.0 | 128.77 | 18.80 | 25.63 | 147.80 | 30.30 | 85.26 | 28.82 | 3.48 | 3476.7 |
| G10 | 82.3 | 111.0 | 122.47 | 16.80 | 23.33 | 175.10 | 25.80 | 89.77 | 27.89 | 3.89 | 3893.3 |
| G11 | 81.0 | 108.7 | 124.03 | 16.33 | 24.60 | 169.03 | 31.90 | 85.54 | 28.53 | 3.83 | 3833.3 |
| G12 | 82.7 | 110.7 | 117.40 | 19.77 | 22.40 | 121.03 | 18.40 | 87.04 | 28.07 | 3.23 | 3230.0 |
| G13 | 86.3 | 110.7 | 128.37 | 20.33 | 25.03 | 132.60 | 16.67 | 88.78 | 25.79 | 3.43 | 3430.0 |
| G14 | 83.7 | 110.0 | 122.03 | 17.60 | 25.27 | 143.43 | 23.33 | 86.08 | 28.74 | 3.46 | 3463.3 |
| G15 | 83.3 | 110.7 | 125.63 | 15.10 | 26.70 | 175.17 | 25.43 | 87.59 | 28.76 | 3.75 | 3753.3 |
| G16 | 81.0 | 110.7 | 125.97 | 13.93 | 23.17 | 173.10 | 18.60 | 90.32 | 29.11 | 3.60 | 3600.0 |
| G17 | 78.7 | 110.7 | 115.67 | 17.47 | 22.83 | 159.00 | 9.30 | 94.48 | 22.82 | 2.81 | 2810.0 |
| G18 | 82.7 | 111.7 | 123.80 | 14.80 | 25.17 | 178.90 | 18.60 | 91.01 | 28.83 | 3.54 | 3540.0 |
| G19 | 82.7 | 112.3 | 120.73 | 16.50 | 24.13 | 176.80 | 29.77 | 85.68 | 27.83 | 3.01 | 3013.3 |
| G20 | 82.7 | 111.7 | 123.90 | 15.53 | 25.07 | 193.80 | 42.63 | 83.97 | 28.54 | 3.57 | 3566.7 |
| G21 | 79.0 | 107.3 | 118.57 | 16.53 | 25.23 | 147.53 | 24.40 | 86.25 | 26.59 | 3.18 | 3176.7 |
| G22 | 82.0 | 110.3 | 129.47 | 14.17 | 24.50 | 149.93 | 20.00 | 88.69 | 31.49 | 3.13 | 3126.7 |
| G23 | 84.0 | 112.3 | 125.37 | 16.67 | 24.20 | 152.47 | 18.60 | 89.34 | 29.54 | 3.27 | 3266.7 |
| G24 | 84.3 | 111.7 | 126.87 | 16.60 | 23.30 | 151.40 | 15.43 | 91.24 | 28.29 | 3.33 | 3333.3 |
| G25 | 77.7 | 108.0 | 125.70 | 15.97 | 23.80 | 135.47 | 13.40 | 90.96 | 27.48 | 3.19 | 3186.7 |
| G26 | 80.0 | 108.3 | 125.70 | 17.87 | 23.73 | 178.33 | 21.17 | 89.70 | 29.81 | 3.39 | 3393.3 |
| G27 | 84.0 | 111.3 | 124.70 | 16.17 | 23.47 | 136.73 | 16.13 | 89.56 | 30.19 | 3.66 | 3660.0 |
| G28 | 82.7 | 110.7 | 129.10 | 15.40 | 22.63 | 137.67 | 13.68 | 90.92 | 29.77 | 3.06 | 3056.7 |
| G29 | 79.3 | 110.3 | 125.17 | 15.23 | 24.63 | 162.90 | 21.63 | 88.02 | 28.67 | 3.28 | 3283.3 |
| G30 | 84.0 | 111.7 | 129.77 | 15.87 | 23.03 | 149.47 | 12.87 | 91.84 | 26.86 | 3.51 | 3513.3 |
| G31 | 81.0 | 111.0 | 126.13 | 18.07 | 23.87 | 175.13 | 16.40 | 91.69 | 29.38 | 3.61 | 3610.0 |
| G32 | 80.7 | 108.3 | 130.07 | 14.37 | 23.90 | 158.07 | 20.90 | 88.94 | 29.09 | 3.27 | 3270.0 |
| G33 | 82.7 | 110.7 | 128.50 | 15.27 | 24.97 | 156.33 | 23.27 | 88.77 | 29.24 | 3.42 | 3423.3 |
| G34 | 82.7 | 111.0 | 128.90 | 15.23 | 23.90 | 153.87 | 26.83 | 87.55 | 29.33 | 3.61 | 3613.3 |
| G35 | 83.3 | 111.3 | 129.30 | 15.27 | 24.67 | 151.53 | 12.67 | 92.27 | 29.89 | 3.27 | 3266.7 |
| G36 | 83.3 | 113.0 | 129.67 | 14.33 | 25.50 | 163.53 | 21.40 | 88.58 | 31.29 | 3.72 | 3723.3 |
| G37 | 84.0 | 111.3 | 127.63 | 15.60 | 23.63 | 155.17 | 17.07 | 90.10 | 28.66 | 3.56 | 3556.7 |
| G38 | 82.0 | 110.7 | 126.67 | 15.53 | 23.40 | 138.80 | 13.40 | 91.20 | 29.92 | 3.20 | 3203.3 |
| G39 | 82.7 | 111.7 | 121.70 | 16.33 | 25.20 | 159.73 | 24.20 | 86.88 | 28.72 | 3.12 | 3120.0 |
| G40 | 82.7 | 111.3 | 128.40 | 15.80 | 22.93 | 137.67 | 24.73 | 84.93 | 28.69 | 3.50 | 3496.7 |
| G41 | 80.7 | 109.3 | 127.57 | 16.70 | 25.00 | 145.90 | 13.47 | 91.43 | 30.06 | 3.42 | 3423.3 |
| G42 | 80.3 | 109.0 | 125.70 | 16.17 | 23.93 | 148.87 | 12.70 | 92.34 | 28.93 | 3.46 | 3463.3 |
| G43 | 81.3 | 109.7 | 131.00 | 14.70 | 24.80 | 136.30 | 20.50 | 86.71 | 28.99 | 3.25 | 3246.7 |
| G44 | 83.3 | 112.0 | 127.30 | 15.03 | 25.30 | 162.13 | 16.13 | 91.07 | 30.17 | 3.58 | 3583.3 |
| G45 | 79.7 | 110.3 | 125.23 | 14.43 | 25.10 | 139.73 | 16.87 | 89.29 | 30.51 | 3.50 | 3496.7 |
| G46 | 82.7 | 110.7 | 130.33 | 14.00 | 24.40 | 168.33 | 20.57 | 89.17 | 31.33 | 3.57 | 3573.3 |
| G47 | 82.7 | 110.3 | 129.80 | 14.40 | 25.63 | 170.30 | 14.80 | 92.25 | 28.23 | 3.39 | 3386.7 |
| G48 | 81.0 | 109.3 | 131.20 | 14.60 | 23.93 | 159.10 | 14.13 | 91.67 | 30.62 | 3.43 | 3426.7 |
| G49 | 82.0 | 112.0 | 131.03 | 14.60 | 25.20 | 195.50 | 18.63 | 91.76 | 30.55 | 3.13 | 3133.3 |
| G50 | 82.0 | 111.7 | 129.63 | 16.70 | 24.40 | 160.87 | 14.90 | 91.40 | 29.18 | 2.75 | 2746.7 |
| G51 | 80.0 | 109.7 | 130.77 | 14.33 | 24.30 | 148.47 | 17.03 | 90.10 | 28.63 | 3.23 | 3226.7 |
| G52 | 82.7 | 110.7 | 126.63 | 14.10 | 23.73 | 168.17 | 8.13 | 95.18 | 29.09 | 3.42 | 3420.0 |
| G53 | 84.0 | 113.0 | 126.43 | 15.37 | 23.63 | 171.90 | 17.93 | 91.16 | 27.49 | 3.31 | 3310.0 |
| G54 | 82.7 | 111.3 | 125.60 | 14.63 | 22.67 | 152.40 | 13.00 | 92.24 | 28.72 | 3.27 | 3270.0 |
| G55 | 83.3 | 111.7 | 135.37 | 17.60 | 24.87 | 117.50 | 12.60 | 90.75 | 26.48 | 3.53 | 3533.3 |
| G56 | 81.3 | 111.7 | 124.33 | 11.00 | 27.67 | 144.67 | 34.33 | 80.88 | 19.39 | 3.24 | 1297.3 |
| G57 | 81.0 | 109.7 | 106.67 | 12.00 | 29.00 | 148.67 | 25.67 | 85.30 | 20.85 | 2.64 | 1054.7 |
| G58 | 86.7 | 110.7 | 168.33 | 13.33 | 27.00 | 143.00 | 24.00 | 85.85 | 23.04 | 3.00 | 1200.0 |
| G59 | 81.3 | 113.0 | 127.67 | 14.67 | 28.33 | 168.00 | 23.67 | 87.65 | 18.16 | 3.21 | 1284.0 |
| G60 | 81.7 | 111.3 | 137.67 | 15.00 | 27.33 | 142.67 | 39.33 | 78.03 | 19.27 | 2.96 | 1184.0 |
| G61 | 83.3 | 111.7 | 134.33 | 12.67 | 25.33 | 120.00 | 5.00 | 99.29 | 23.80 | 1.45 | 580.0 |
| G62 | 81.3 | 111.0 | 137.67 | 13.33 | 27.67 | 171.33 | 30.00 | 85.34 | 19.55 | 3.35 | 1338.7 |
| G63 | 85.0 | 111.0 | 122.33 | 12.33 | 24.67 | 133.33 | 14.67 | 90.06 | 20.10 | 3.40 | 1360.0 |
| G64 | 83.3 | 111.3 | 133.33 | 13.33 | 28.33 | 150.00 | 32.67 | 82.37 | 21.70 | 1.40 | 558.7 |
| G65 | 79.7 | 112.0 | 131.67 | 10.67 | 30.00 | 155.00 | 25.00 | 86.16 | 18.65 | 2.24 | 897.3 |
| G66 | 82.3 | 111.7 | 111.67 | 12.33 | 29.67 | 132.67 | 30.67 | 81.05 | 18.45 | 4.37 | 1748.0 |
| G67 | 85.0 | 111.7 | 101.67 | 7.67 | 25.33 | 142.00 | 15.00 | 90.58 | 22.62 | 3.11 | 1244.0 |
| G68 | 80.7 | 107.0 | 142.67 | 8.67 | 24.33 | 125.00 | 71.00 | 63.78 | 19.95 | 2.24 | 897.3 |
| G69 | 82.0 | 110.7 | 120.67 | 9.33 | 30.67 | 204.00 | 43.33 | 82.34 | 20.50 | 3.41 | 1365.3 |
| G70 | 81.3 | 107.7 | 106.67 | 7.33 | 21.67 | 128.33 | 24.00 | 84.33 | 22.96 | 2.61 | 1045.3 |
| G71 | 81.3 | 111.0 | 121.67 | 7.00 | 23.67 | 117.33 | 44.67 | 72.56 | 21.31 | 2.69 | 1076.0 |
| G72 | 82.7 | 110.7 | 60.00 | 6.33 | 23.67 | 95.33 | 30.67 | 75.75 | 21.02 | 2.49 | 997.3 |
| G73 | 84.3 | 110.3 | 103.33 | 9.33 | 26.00 | 119.00 | 27.00 | 81.59 | 24.44 | 3.39 | 1357.3 |
| G74 | 82.3 | 111.7 | 148.33 | 10.00 | 22.33 | 102.33 | 18.33 | 84.63 | 19.81 | 3.07 | 1228.0 |
| G75 | 82.7 | 111.0 | 90.67 | 8.67 | 25.33 | 150.67 | 25.00 | 85.74 | 20.84 | 2.66 | 1062.7 |
| G76 | 85.0 | 112.0 | 123.33 | 10.00 | 21.33 | 85.00 | 18.33 | 82.32 | 25.68 | 2.18 | 872.0 |
| G77 | 86.3 | 109.7 | 107.33 | 8.33 | 21.00 | 109.67 | 27.00 | 80.32 | 20.27 | 3.34 | 1337.3 |
| G78 | 86.3 | 111.0 | 110.67 | 10.33 | 26.67 | 117.33 | 20.33 | 85.24 | 19.67 | 2.65 | 1060.0 |
| G79 | 81.3 | 111.0 | 153.33 | 10.67 | 28.67 | 101.00 | 31.33 | 76.24 | 23.72 | 2.31 | 925.3 |
| G80 | 81.3 | 112.3 | 113.33 | 11.33 | 28.33 | 112.67 | 20.33 | 84.71 | 26.74 | 4.03 | 1612.0 |
| G81 | 81.7 | 111.3 | 109.00 | 11.67 | 24.33 | 97.67 | 26.67 | 78.67 | 28.94 | 3.37 | 1348.0 |
| G82 | 86.7 | 111.3 | 123.33 | 10.67 | 25.33 | 128.33 | 16.67 | 88.53 | 27.13 | 2.16 | 865.3 |
| G83 | 86.7 | 110.7 | 132.33 | 11.33 | 21.00 | 191.33 | 56.00 | 77.40 | 27.21 | 5.23 | 2093.3 |
| G84 | 80.7 | 110.7 | 123.33 | 10.67 | 24.00 | 141.00 | 33.33 | 81.14 | 29.69 | 4.12 | 1649.3 |
| G85 | 85.0 | 109.0 | 133.33 | 11.33 | 25.33 | 133.67 | 16.00 | 89.32 | 30.22 | 2.76 | 1105.3 |
| G86 | 81.3 | 108.0 | 92.33 | 9.33 | 27.33 | 132.00 | 17.67 | 88.22 | 28.31 | 2.81 | 1124.0 |
| G87 | 80.0 | 110.7 | 81.67 | 8.33 | 26.67 | 150.67 | 19.33 | 88.28 | 28.90 | 4.00 | 1598.7 |
| G88 | 82.7 | 110.3 | 126.67 | 9.33 | 26.33 | 150.67 | 22.67 | 86.95 | 29.34 | 4.04 | 1617.3 |
| G89 | 86.0 | 111.3 | 139.33 | 10.67 | 20.67 | 101.00 | 13.00 | 88.22 | 29.55 | 3.06 | 1224.0 |
| G90 | 82.7 | 109.3 | 93.33 | 10.33 | 21.00 | 104.33 | 20.67 | 83.56 | 28.45 | 2.17 | 868.0 |
| G91 | 81.7 | 109.0 | 116.67 | 10.00 | 23.00 | 115.67 | 43.67 | 72.62 | 28.20 | 4.71 | 1884.0 |
| G92 | 81.0 | 109.7 | 112.33 | 8.67 | 24.67 | 128.00 | 48.67 | 72.63 | 29.36 | 2.99 | 1194.7 |
| G93 | 82.7 | 112.0 | 111.67 | 10.67 | 26.00 | 125.67 | 35.00 | 78.12 | 28.90 | 3.85 | 1541.3 |
| G94 | 84.0 | 110.3 | 116.33 | 12.33 | 27.33 | 182.67 | 78.33 | 69.98 | 26.95 | 3.79 | 1516.0 |
| G95 | 82.3 | 110.7 | 132.33 | 7.00 | 27.67 | 196.67 | 15.00 | 92.93 | 28.33 | 3.53 | 1410.7 |
| G96 | 85.0 | 110.3 | 125.67 | 8.67 | 23.67 | 207.00 | 41.67 | 82.89 | 27.12 | 3.96 | 1582.7 |
| G97 | 82.3 | 109.3 | 102.33 | 8.33 | 25.00 | 155.67 | 18.33 | 89.46 | 29.74 | 2.27 | 909.3 |
| G98 | 84.3 | 112.0 | 134.67 | 9.33 | 24.33 | 126.00 | 23.33 | 84.53 | 28.37 | 4.86 | 1942.7 |
| G99 | 83.3 | 112.0 | 121.33 | 9.67 | 24.67 | 102.67 | 24.67 | 80.66 | 27.46 | 2.62 | 1048.0 |
| G100 | 82.0 | 109.3 | 110.67 | 9.33 | 26.00 | 114.33 | 34.67 | 76.89 | 28.70 | 3.06 | 1224.0 |
| G101 | 83.7 | 109.0 | 134.67 | 11.00 | 25.33 | 115.00 | 14.67 | 88.72 | 27.09 | 4.03 | 1612.0 |
| Mean | 82.49 | 110.64 | 123.62 | 13.40 | 24.83 | 146.21 | 23.34 | 86.56 | 26.95 | 3.27 | 2405.03 |
| Max. | 86.7 | 113 | 168.33 | 20.33 | 30.67 | 207 | 78.33 | 99.29 | 32.1 | 5.23 | 3893.3 |
| Min. | 77.7 | 107 | 60 | 6.33 | 20.67 | 85 | 5 | 63.78 | 18.16 | 1.4 | 558.7 |
| SD | 1.81 | 1.28 | 13.72 | 3.37 | 1.95 | 25.35 | 11.78 | 5.82 | 3.65 | 0.60 | 1091.58 |
Note: DF: Days to 50% Flowering; DM: Days to Maturity; PH: Plant Height; TP: Total Tillers per Plant; PL: Panicle Length; G/P: Grains per Panicle; UG/P: Unfilled Grains per Panicle; SS: Spikelet Sterility; TGW: Thousand Grain Weight; Y/P: Yield per Plant; Y/H: Yield per Hectare
Table 1. Mean data of 101 rice genotypes for the studied traits.
| Traits | SNP | Chromosome | Position | P value | R% |
|---|---|---|---|---|---|
| Days of 50% flowering | OsGRb14914 | 7 | 20814664 | 0.000112756 | 19.66 |
| OsGRb15039 | 7 | 22304042 | 0.000112756 | 19.66 | |
| OsGRb05211 | 2 | 29829169 | 0.000115539 | 19.61 | |
| OsGRb04064 | 2 | 16775829 | 0.000254602 | 17.88 | |
| OsGRb04108 | 2 | 17345198 | 0.000282383 | 17.66 | |
| OsGRb04456 | 2 | 21810979 | 0.000314737 | 17.43 | |
| OsGRb04559 | 2 | 22869364 | 0.000314737 | 17.43 | |
| OsGRb04569 | 2 | 23120515 | 0.000314737 | 17.43 | |
| OsGRb30142 | 2 | 24285137 | 0.00034923 | 17.2 | |
| OsGRb04511 | 2 | 22354743 | 0.000358582 | 17.15 | |
| OsGRb16114 | 8 | 8615206 | 0.000426811 | 16.78 | |
| OsGRb16145 | 8 | 8929911 | 0.000449302 | 16.67 | |
| OsGRb04104 | 2 | 17309380 | 0.000512281 | 16.39 | |
| OsGRb04421 | 2 | 20975538 | 0.000519788 | 16.36 | |
| OsGRb04893 | 2 | 26259806 | 0.000555053 | 16.22 | |
| OsGRb21146 | 11 | 15034296 | 0.000563352 | 16.19 | |
| OsGRg02884 | 2 | 19568531 | 0.000566321 | 16.18 | |
| OsGRg03095 | 2 | 23712290 | 0.000566321 | 16.18 | |
| Maturity Days (DM) | OsGRb25451 | 3 | 24409509 | 0.000582683 | 16.12 |
| OsGRb21461 | 11 | 19084575 | 0.000582683 | 16.12 | |
| OsGRg14009 | 11 | 18935157 | 0.000582683 | 16.12 | |
| OsGRb05101 | 2 | 28940961 | 0.000596317 | 16.07 | |
| OsGRg02717 | 2 | 11885546 | 0.000596317 | 16.07 | |
| OsGRb04072 | 2 | 16904305 | 0.000600264 | 16.06 | |
| OsGRb04943 | 2 | 26640578 | 0.000631732 | 15.95 | |
| OsGRg03565 | 2 | 30862290 | 0.000725216 | 15.66 | |
| OsGRb21548 | 11 | 19994753 | 0.000735707 | 15.63 | |
| OsGRg02708 | 2 | 11594325 | 0.000752687 | 15.58 | |
| OsGRb25462 | 3 | 25181277 | 0.000767637 | 15.54 | |
| OsGRb25459 | 3 | 25131417 | 0.000772959 | 15.53 | |
| OsGRg05363 | 3 | 24961621 | 0.000772959 | 15.53 | |
| OsGRb21468 | 11 | 19129697 | 0.000772959 | 15.53 | |
| OsGRb21471 | 11 | 19170789 | 0.000772959 | 15.53 | |
| OsGRb32442 | 11 | 19026652 | 0.000772959 | 15.53 | |
| OsGRg03058 | 2 | 23529294 | 0.000791106 | 15.48 | |
| OsGRg03325 | 2 | 26931234 | 0.000831996 | 15.37 | |
| OsGRb30127 | 2 | 22416322 | 0.000839333 | 15.35 | |
| OsGRb17703 | 9 | 11125119 | 0.000159335 | 11.74 | |
| Plant Height (PH) | OsGRb30717 | 4 | 29956594 | 5.59E-05 | 17.27 |
| OsGRb09705 | 4 | 29950172 | 0.000117035 | 15.52 | |
| OsGRb31240 | 7 | 9363018 | 0.000119296 | 15.47 | |
| OsGRb12976 | 6 | 16465767 | 0.000121861 | 15.42 | |
| OsGRb13852 | 7 | 485365 | 0.000134253 | 15.2 | |
| OsGRb13891 | 7 | 754356 | 0.000134253 | 15.2 | |
| OsGRg01923 | 1 | 39950738 | 0.000256562 | 13.7 | |
| OsGRb13812 | 7 | 219361 | 0.000418686 | 12.58 | |
| OsGRb14044 | 7 | 1929142 | 0.000492237 | 12.21 | |
| OsGRb28184 | 8 | 14792948 | 0.000524592 | 12.07 | |
| OsGRb27102 | 6 | 24322609 | 0.0005983 | 11.77 | |
| OsGRb27139 | 6 | 25535681 | 0.0005983 | 11.77 | |
| OsGRg05238 | 3 | 21673888 | 0.000648167 | 11.6 | |
| OsGRb14503 | 7 | 15365358 | 0.000664937 | 11.54 | |
| Panicle Length (PL) | OsGRg09425 | 6 | 21482221 | 0.000860313 | 15.54 |
| OsGRb24377 | 1 | 40794243 | 0.000190652 | 13.89 | |
| OsGRb25787 | 4 | 12725098 | 0.00026478 | 18.31 | |
| OsGRb09155 | 4 | 19209543 | 0.000283155 | 18.16 | |
| OsGRb08910 | 4 | 14035735 | 0.000287425 | 18.13 | |
| OsGRb25664 | 4 | 8124043 | 0.000302411 | 18.02 | |
| OsGRb09180 | 4 | 19850601 | 0.00030797 | 17.98 | |
| OsGRg06407 | 4 | 19601384 | 0.000626121 | 17.9 | |
| OsGRb25839 | 4 | 17182231 | 0.000690069 | 17.36 | |
| OsGRg06490 | 4 | 21414906 | 0.000703709 | 17.36 | |
| OsGRg06518 | 4 | 22025935 | 0.000718576 | 17.34 | |
| OsGRb17738 | 9 | 11674055 | 0.0007187 | 17.33 | |
| OsGRg11329 | 8 | 3389509 | 0.00072166 | 17.32 | |
| OsGRb25742 | 4 | 10354477 | 0.000732621 | 17.32 | |
| OsGRb09195 | 4 | 20025177 | 0.000732792 | 17.31 | |
| OsGRb09323 | 4 | 21564212 | 0.000733361 | 17.29 | |
| OsGRg06481 | 4 | 21313607 | 0.000733361 | 17.2 | |
| Seed Setting percentage (SS) | OsGRb08806 | 4 | 12650451 | 0.000733361 | 17.17 |
| OsGRb08813 | 4 | 12874705 | 0.000733361 | 17.16 | |
| OsGRg06306 | 4 | 11320635 | 0.000258291 | 18.36 | |
| OsGRb25787 | 4 | 12725098 | 0.00026478 | 18.31 | |
| OsGRb09155 | 4 | 19209543 | 0.000283155 | 18.16 | |
| OsGRb08910 | 4 | 14035735 | 0.000287425 | 18.13 | |
| OsGRb25664 | 4 | 8124043 | 0.000302411 | 18.02 | |
| OsGRb09180 | 4 | 19850601 | 0.00030797 | 17.98 | |
| OsGRg06407 | 4 | 19601384 | 0.000626121 | 17.9 | |
| OsGRg06430 | 4 | 19893385 | 0.000626121 | 17.88 | |
| OsGRg06261 | 4 | 6968387 | 0.000653867 | 17.82 | |
| OsGRb25862 | 4 | 19570740 | 0.000655505 | 17.77 | |
| OsGRb09200 | 4 | 20060586 | 0.000665116 | 17.77 | |
| OsGRb09238 | 4 | 20485782 | 0.000665116 | 17.7 | |
| OsGRb09240 | 4 | 20505437 | 0.000665116 | 17.67 | |
| OsGRg06458 | 4 | 20426851 | 0.00067696 | 17.66 | |
| OsGRb08754 | 4 | 11300762 | 0.000678377 | 17.56 | |
| OsGRg06304 | 4 | 11316471 | 0.000678377 | 17.49 | |
| OsGRb25740 | 4 | 10304323 | 0.000683696 | 17.45 | |
| OsGRb08742 | 4 | 10624962 | 0.000688745 | 17.39 | |
| OsGRb25839 | 4 | 17182231 | 0.000690069 | 17.36 | |
| OsGRg06490 | 4 | 21414906 | 0.000703709 | 17.36 | |
| OsGRg06518 | 4 | 22025935 | 0.000718576 | 17.34 | |
| OsGRb17738 | 9 | 11674055 | 0.0007187 | 17.33 | |
| OsGRg11329 | 8 | 3389509 | 0.00072166 | 17.32 | |
| OsGRg06481 | 4 | 21313607 | 0.000733361 | 17.2 | |
| OsGRb08806 | 4 | 12650451 | 0.000733361 | 17.17 | |
| OsGRb08813 | 4 | 12874705 | 0.000733361 | 17.16 | |
| OsGRb08766 | 4 | 11794996 | 0.00091055 | 16.53 | |
| OsGRg06245 | 4 | 6939489 | 0.000910949 | 16.5 | |
| OsGRb15974 | 8 | 6205816 | 0.000922788 | 16.47 | |
| OsGRg06447 | 4 | 20096863 | 0.000922968 | 16.47 | |
| 1000 Grain Weight (TGW) | OsGRb23906 | 1 | 10116371 | 0.000902976 | 15.63 |
| OsGRb05492 | 2 | 34355959 | 0.000148332 | 14.6 | |
| OsGRg01164 | 1 | 28331892 | 0.000216037 | 13.83 | |
| OsGRb21690 | 11 | 21789361 | 0.000222423 | 13.77 | |
| Tiller/ Plant (TP) | OsGRb13190 | 2 | 20245648 | 0.00021125 | 16.57 |
| OsGRg04556 | 1 | 6518355 | 0.000107335 | 14.09 | |
| OsGRg03402 | 7 | 28582430 | 0.000239771 | 12.44 | |
| OsGRb29047 | 4 | 858733 | 0.000269943 | 12.12 | |
| Unfilledled Grain (UG/P) | OsGRg06432 | 8 | 285322 | 0.000292806 | 15.47 |
| OsGRb14503 | 7 | 15365358 | 0.000324535 | 15.51 |
Table 2. Results of 147 polymorphic SSR markers used in 101 rice genotype.
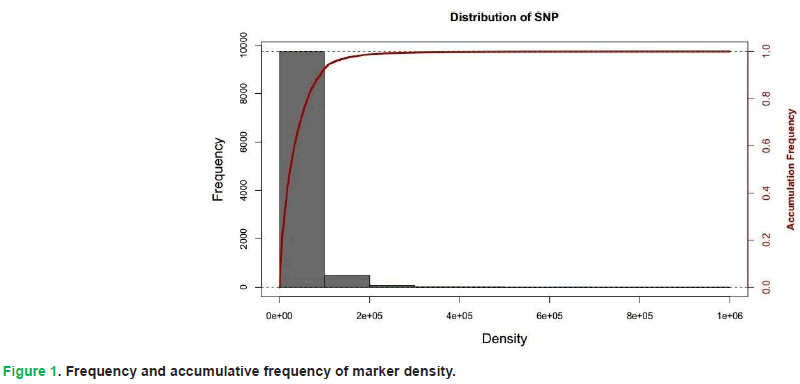
Figure 1: Frequency and accumulative frequency of marker density.
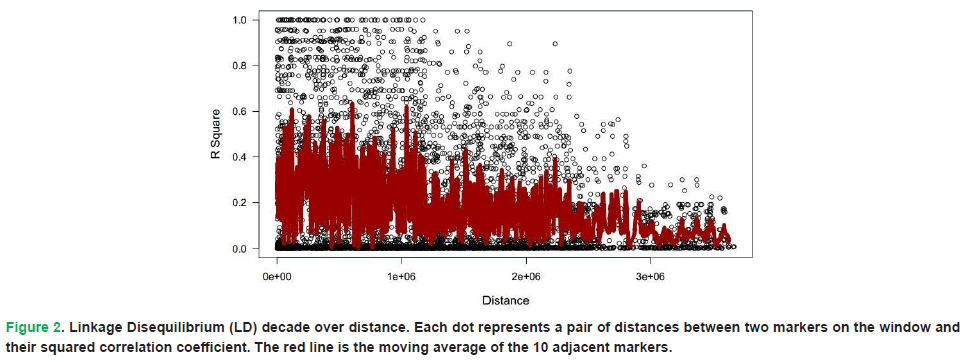
Figure 2: Linkage Disequilibrium (LD) decade over distance. Each dot represents a pair of distances between two markers on the window and their squared correlation coefficient. The red line is the moving average of the 10 adjacent markers.
Days to 50 percent Flowering (DF)
Markers linked to Days to 50% Flowering (DF) showed between 16.18% and 19.66% of the overall PV (Phenotypic Variation). In this investigation, SNP (OsGRb14914) on chromosome 7 indicate that highest value of trait variability (19.66%), while the SNP (Os- GRb03095) on chromosome 2 indicate the lowest value (16.18%) (Tab. 2).
Days to Maturity (DM)
Twenty SNPs were found to be associated with DM in GWAS using 101 rice genotypes. Of these, one was from chromosome 3 (OsGRb25451) and one from chromosome 9 (OsGRb17703) in Tab. 2.
Plant Height (PH)
In this study, fourteen SNP markers showed a strong correlation with plant height. On chromosome 4 the SNP marker OsGRb30717 described the highest phenotypic trait variability (17.27%), and chromosome 7 the marker OsGRb14503 indicated the lowest value (11.54%).
Number of Grains per Panicle (G/P)
This analysis found four significant MTAs for this characteristic, all of which were SNPs on chromosome 9 (Tab. 2). For this trait, the marker (OsGRb31905) on chromosome described the most variation (20.76%), whereas the marker (OsGR18178) on 9 (Fig. 2) explained the least variation (18.69%).
Panicle Length (PL)
These important SNAPs for PL were found on 6,1 chromosomes (Tab. 2). In this marker (OsGRb09425) on chromosome 6 indicated the greatest PV (13.89%), marker (OsGRb24377) on 1 chr explained the least variation (13.89%) for panicle length.
Seed Setting Percentage (SS)
47 MTAs were identified to have a significant relationship with Seed Setting Percentage (SS). On chromosome 4 the SNP marker (OsGR25787) described the highest value of variability (18.31%), second marker (OsGRb06447) from the same chromosome explained the lowest value (16.33%) of phenotypic variance in this study.
Tillers per Plant (TP)
The number of T/P was strongly related with 4 SNPs. The SNPs OsGRb13190, OsGRg04556, OsGRg03402, and OsGRb29047, which are situated on chromosomes 2, 1, 7, and 4, were found to be significantly linked with this trait.
Unfilled Grains per Panicle (UG/P)
A total of 23 major MTAs were substantially associated with unfilled grain. The SNP (OsGRg06432) on chromosome 5 explained the highest variation (15.47%), whereas the SNP (OsGRg11936) on chromosome 4 lowest variation (12.17%) for unfilled grain.
Yield per Hectare (Y/H)
Yield per hectare was strongly linked with 4 MTAs. Marker (OsGRb20655) indicated high variation (18.84%) on chromosome 11 in this study.
Yield per Plot (Y/P)
Five noteworthy MTAs were linked to yield per marijuana in this investigation. MTA for YP was found on chromosomes 4, 8, 7, 7, and 9 (Tab. 2). OsGRb09543 is one of the markers that have a strong correlation with yield per hectare (Fig. 1). 15.03% to 15.86% of the phenotypic variation in this characteristic was explained by all of these SSRs. The largest phenotypic variation (15.03%) in Table 2 was explained by the marker (OsGR12112) on chromosome 9. Six chromosomal areas on chromosomes 1, 2, 3, 5, and 6 were found by Hu, et al. 2013.
Conclusion
The results revealed here present an opportunity to clone genes and employ Marker-Assisted Selection (MAS) for pertinent features to produce a pleiotropic locus associated with several phenotypic variables. SS (OsGR25787), UG/P (OsGRg06432), Y/H (OsGRb20655) another traits PL (OsGRb09425 and OsGRb24377), markers (OsGRb25803, and OsGRb15974) were shown to be significantly correlated with the locus (OsGRb30591) on different chromosome and position. The significant effects of these key markers may be very beneficial in marker-assisted QTL pyramiding to boost rice production and other yield-related attributes.
References
- Abbas A, Rashad A, Rehman AU, Bukhari MS. (2024). Exploring the response mechanisms of rice to salinity stress. Bull Biol All Sci Res. 2024:1-10.
- FAO. (2024). The state of food and agriculture: Food security: Some macroeconomics dimensions. 43-44.
- Farooq A, Khan UM, Riaz A, Maqbool R, Ali Z, Sajjad M. (2024). Genomes, pangenomes, and super pangenomes of cereals: How to translate the generated information into genetic gains. Omics and System Biology Approaches for Delivering Better Cereals. CRC Press. 49-70.
- Gärtner T, Steinfath M, Andorf S, Lisec J, Meyer RC, Altmann T, Willmitzer L, Selbig J. (2009). Improved heterosis prediction by combining information on DNA-and metabolic markers. PLoS ONE. 4:e5220.
[Crossref] [Google Scholar] [PubMed]
- Hu W, Wen M, Han Z, Tan C, Xing Y. (2013). Scanning QTLs for grain shape using a whole genome SNP array in rice. J Plant Biochem. Physiol. 1:104. PLoS ONE. 13:e0198012.
- Huang X, Wei X, Sang T, Zhao Q, Feng Q, Zhao Y, Li C, Zhu C, Lu T, Zhang Z, Li M. (2010). Genome-wide association studies of 14 agronomic traits in rice landraces. Nat Genet. 42:961-967.
[Crossref] [Google Scholar] [PubMed]
- Ishtiaq M, Atif M, Manzoor MT, Sarwar M, Rafaqat N. (2019). Analysis of different allelopathic plant extracts and fungal metabolites on rice to control rice grain discoloration. Bull Biol All Sci Res. 2019:1-3.
- Javed MM, Sami A, Haider MZ, Abbas A, Ali MH, Naeem S, Amjad M, Ahmad A, Bostani R. (2024). The contribution of transgenic rice to enhance grain yield. Bull Biol All Sci Res. 2024:1-13.
- Murray MG, Thompson W. (1980). Rapid isolation of high molecular weight plant DNA. Nucleic Acids Res. 8:4321-4326.
[Crossref] [Google Scholar] [PubMed]
- Steel RGD, Torrie JH, Dickey DA. (1997). Principles and procedures of statistics: a biometrical approach. 3rd ed.: McGraw-Hill, New York, USA.
- Sukumaran S, Dreisigacker S, Lopes M, Chavez P, Reynolds MP. (2015). Genome-wide association study for grain yield and related traits in an elite spring wheat population grown in temperate irrigated environments. Theor Appl Genet. 128:353-63.
[Crossref] [Google Scholar] [PubMed]
- Suvi WT, Shimelis H, Laing M, Mathew I, Shayanowako AI. (2020). Assessment of the genetic diversity and population structure of rice genotypes using SSR markers. Acta Agric Scand, Sect B-Soil Plant Sci. 70:76-86.
- Thakur AK, Rath S, Patil DU, Kumar A. (2011). Effects on rice plant morphology and physiology of water and associated management practices of the system of rice intensification and their implications for crop performance. Paddy Water Environ. 9:13-24.
- Upadhyay PU, Singh VK, Neeraja CN. (2011). Identification of genotype specific alleles and molecular diversity assessment of popular rice (Oryza sativa L.) varieties of India. CABI Databases. 5:130-140.
- Verma H, Borah JL, Sarma RN. (2019). Variability assessment for root and drought tolerance traits and genetic diversity analysis of rice germplasm using SSR markers. Sci Rep. 9:16513.
[Crossref] [Google Scholar] [PubMed]
- Wang S, Wong D, Forrest K, Allen A, Chao S, Huang BE, Maccaferri M, Salvi S, Milner SG, Cattivelli L, Mastrangelo AM. (2014). Characterization of polyploid wheat genomic diversity using a highâdensity 90 000 single nucleotide polymorphism array. Plant Biotechnol J. 12:787-796.
[Crossref] [Google Scholar] [PubMed]
- Wijerathna-Yapa A, Bishnoi R, Ranawaka B, Magar MM, Rehman HU, Bharad SG, Lorenc MT, Ramtekey V, Gohar S, Lata C, Harun-Or-Rashid M. (2024). Rice-wheat comparative genomics: Gains and gaps. Crop J. 12:656-669.
- Yuan HZ, Ran ZB, Ming LQ, Qin FX, Yun XY, Ping YL. (2015). Heterosis expression of hybrid rice in natural-and short-day length conditions. CABI Databases. 22:81-88.
- Zhao K, Tung CW, Eizenga GC, Wright MH, Ali ML, Price AH, Norton GJ, Islam MR, Reynolds A, Mezey J, McClung AM. (2011). Genome-wide association mapping reveals a rich genetic architecture of complex traits in Oryza sativa. Nat Commun. 2:467.
[Crossref] [Google Scholar] [PubMed]