Research - Modern Phytomorphology ( 2021) Volume 15, Issue 4
A program for assessing the level of stress load on plants of raised bogs in Western Siberia by the method of fractal analysis
A.V. Scherbakov1, V.V. Aleksandrova2, V.I. Egorova2 and V.B. Ivanov3*2Department of Biological Sciences, Nizhnevartovsk State University, Lenina St. 56, 628605, Nizhnevartovsk, Russia
3Department of Pedagogical Sciences, Nizhnevartovsk State University, Lenina St. 56, 628605, Nizhnevartovsk, Russia
V.B. Ivanov, Department of Pedagogical Sciences, Nizhnevartovsk State University, Lenina St. 56, 628605, Nizhnevartovsk, Russia, Email: karatazh@mail.ru
Received: 09-Jul-2021 Accepted: 22-Jul-2021 Published: 30-Jul-2021, DOI: 10.5281/zenodo.5801205
Abstract
http://www.environmentjournals.com/
http://www.eventsupporting.org/
http://www.escientificreviews.com/
http://www.openaccesspublications.com/
http://www.imedpub.org/
http://www.jpeerreview.com/
http://www.escientificres.com/
http://www.scholarlyjournals.org/
http://www.eclinicaljournals.com/
http://www.scischolarsjournal.com/
http://www.intlscholarsjournal.com/
http://www.scholarsresjournal.com/
http://www.sysrevpharma.org/
http://www.environjournal.com/
http://www.jpeerres.com/
http://www.managjournal.org/
http://www.emedicalhub.org/
http://www.biomedresj.org/
http://www.aaccongress.com/
http://www.eclinicalres.org/
http://www.scholarlymed.com/
http://www.eclinicalres.com/
http://www.theresearchpub.com/
http://www.imedpubscholars.com/
http://www.scholarcentral.org/
http://www.journalpublications.org/
http://www.scholarlypub.com/
http://www.imedpublishing.org/
http://www.emedsci.com/
http://www.longdomjournals.org/
http://www.longdomjournal.org/
http://www.emedicalcentral.com/
http://www.lexisjournal.com/
http://www.geneticjournals.com/
http://www.scitecjournals.com/
http://www.microbialjournals.org/
http://www.engjournals.org/
http://www.eneurologyjournals.com/
http://www.pulsusjournal.org/
http://www.biochemjournal.org/
http://www.epharmacentral.com/
http://www.eclinicalsci.com/
http://www.eclinicalcentral.com/
http://www.eclinmed.com/
http://www.jopenaccess.org/
http://www.peerreviewedjournals.com/
http://www.immunologyjournals.com/
http://www.neurologyjournals.org/
http://www.clinicalmedicaljournals.com/
http://www.molecularbiologyjournals.com/
http://www.geneticsjournals.com/
http://www.biochemistryjournals.org/
http://www.psychiatryjournals.org/
http://www.pharmajournals.org/
http://www.alliedresearch.org/
http://www.medicalres.org/
http://www.medicalresjournals.com/
http://www.alliedsciences.org/
http://www.pediatricsjournals.org/
http://www.oncologyinsights.org/
Keywords
Fractal analysis, self-similarity, habitat, stress, morphological and physiological parameters, variability
Abstract
This paper presents a computer program that uses fractal analysis to calculate the stress that plants in different habitats are exposed to.
Introduction
The diversity, complex dynamics, and suboptimality of individual environmental factors are natural for plant habitats (Gaston et al. 2005; Bever et al. 2010; Mavletova- Chistyakova et al. 2017; Ivanov et al. 2016; Aleksandrova et al. 2020). This gives plants a complex and plastic pattern of adaptive responses. This pattern can be effectively evaluated in terms of multiple direct and allometric, morphological and physiological indicators (Usmanov 1986; Bundy et al. 2009; Tilman 2004).
The plastic, multivariant adaptation is the plant’s response to the multivariant, unpredictable habitat. This principle can be referred to as multiplicity of primary adaptive responses (Mandelbrot 1982; Rosenberg 1984, 2013; Hubbell 2001, 2006; Mc Gill 2010; Ivanov et al. 2018, 2019, 2021).
The principle essentially consists in triggering multiple defenses at a time to respond to this or that stress; the list of such defenses depends on the resources available to the plant. The list intensity ratio of these defense mechanisms in individual plant specimens may vary daily whether in a laboratory setup or in the field. This makes it difficult to evaluate the impact of individual factors and the general level of stress that plants in this or that habitat are exposed to. Plants often lack a stable and mathematically significant correlation between the intensity of a stress factor and that of the adaptive mechanism the stressor triggers. For that reason, there is a simple and versatile stress assessment method applicable to plants, especially in natural habitats (Kimura 1983; Lambers et al. 2008).
More intense stress is associated with lower resources available to the plant and its defenses. This forces plants to cut short the list of such defenses, making them statistically ‘more identical’. This fully applies to plants in the oligotrophic wetlands of Western Siberia (Usmanov et al. 2016-2021; Volkov et al. 2018; Scherbakov et al. 2021). This idea underlies the fractal analysis program for the assessment of stress in plants.
Therefore, it might be safe to say that the log Mqlog N correlation coefficient for different species in their natural habitats can be used as a universal stress indicator.
Materials and Methods
This study produced a general algorithm of how to use fractal analysis to assess the condition of plants exposed to a varying degree of stress. Fractal analysis-based testing for stress involves these steps:
• Collect specimen-specific indicator values
• Add the input to the unified matrix
• Find (if necessary, adjust) the scaling range q
• Run the fractal analysis
• Find the log Mq-log N correlation coefficients
• Compare the coefficients against the reference, i.e., against the values typical of regular objects (-1 for negative q, 1 for positive q)
• Find the deviation of the correlation coefficient from the reference for each q
• Assess the stress
Calculations under Steps 4 to 7 of the above algorithm have been automated for Excel 2013.
Results and Discussion
Functionally, the program consists of several modules, some of which are shown in Fig’s 1-3.
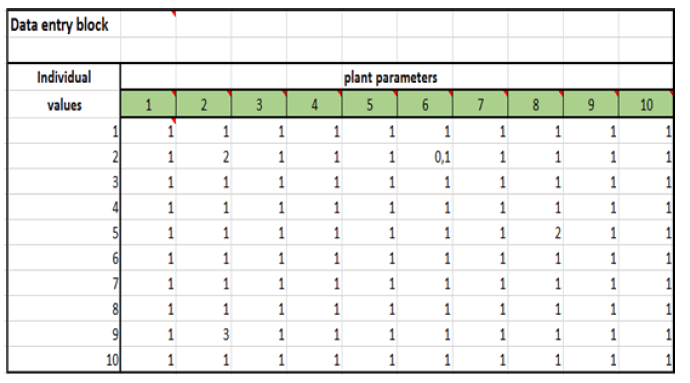
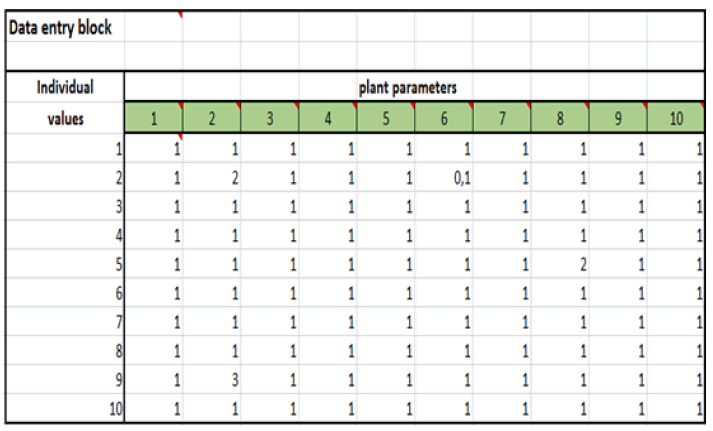
During the study of the level of stress load on plants, individual values of the recorded plant parameters are included in the table shown in Fig. 1. The same indicators should be recorded for plants of the same species in different habitats. If necessary, the matrix size can be increased to the target dimensions.

Figure 1: Data input.
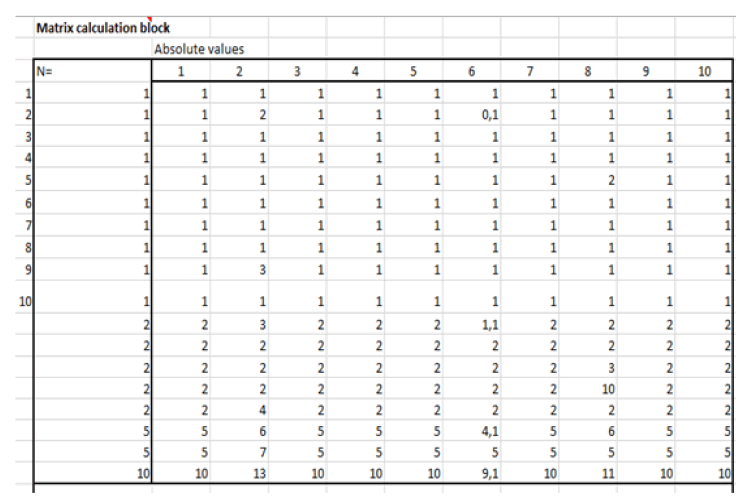
Fig. 2 shows a table that is a hierarchical matrix automatically calculated based on the grouping of data included in Fig. 1.

Figure 2: Matrix calculator.
The “N” column shows how many cells the results are used from:
“N=1”-individual data is included from the table in Fig. 1;
“N=2”-the sum of the values of 2 source cells from the table in Fig. 1 is included in the cell;
“N=3-9”-the total values of 3–9 source cells from the table in Fig. 1 are included in the cell;
“N=10”-the total values of all 10 source cells are included in the cell. A summation of individual plant indicators is performed for each column (Fig. 2).
These calculations are necessary for evaluating and comparing the indicators of the studied data array at various levels of its organization–from individual to group (Gelashvili et al. 2013; Ivanov et al. 2019).
Data input in Fig. 1 is used to enter specimen-specific values of the researcher-selected parameters. The table can be enlarged if need be. Input requirements are as follows:
1. Avoid zeroes as they can distort correlations significantly.
2. Use a composite number of specimens (10, 12, 15, 16, 18, 20, etc.) to be able to scale.
In the future, the matrix shown in Fig. 2 undergoes the following transformations:
1. Ranking by variables of each indicator.
2. Calculating the exponent of the logarithm “N” to the base 10 (log N).
3. Scaling, state assessment of the contents of the specified matrix (Fig. 2) at various scale measures.
The scale measures are set by the researcher and are denoted as “q”. It is considered correct to use both negative and positive “q” values. The value of the “q” indicator shows to what power the contents of the matrix under study are raised in each case.
Based on the results of these calculations (Gelashvili et. al 2013; Ivanov et. al 2019), for each “N” level and “q” value, the “Mq” indicator is calculated, which reflects the participation of a single individual indicator in the formation of the level of stress load on the plant. In the future, for each “Mq” value, the logarithm to the base 10 (log Mq) is also calculated and the results are included in the corresponding cell of the table in Fig. 3.

Figure 3: Statistics and self-similarity estimator (the cells show the values of the log Mq indicator for different values of Log N and q).
Thus, the use of the fractal analysis method in assessing the level of stress load on plants is based on the following logical assumptions:
1. For plants in natural conditions, the effect of various types of stress associated with non-optimal living conditions is normal-non-optimal temperature, lack or excess of water, root hypoxia, salinization, etc. Plants respond to any type of stress in a polyvariant way, i.e., they launch as many protective mechanisms as they can afford, which is typical for any environmental factor. Such a polyvariant nature of the responses inherent in plants leads to the very high plasticity of the physiologically adaptive mechanisms of particular plants. Against this background, in most cases, it is not possible to trace a significant relationship between the level of a particular stress factor and the intensity of any triggered response mechanism.
2. As the stress load increases, regardless of the number and nature of the active stress factors, the overall resource supply of plants will inevitably decrease. As a result, the total composition of the adaptive mechanisms used by plants will be smaller, which will lead to an increase in the similarity between the adaptive reactions of individual plants. However, as practice shows, this is not enough for the application of traditional statistical methods. As a rule, it is impossible to track the relationship between the level of stress load and the intensity of the response of a particular plant.
3. The fractal analysis allows us to assess how much individual indicators are generally similar to each other, from the point of view of functioning under the same conditions, and physiological mechanisms. As a result, it all comes down to determining the correlation factor between log N and log Mq.
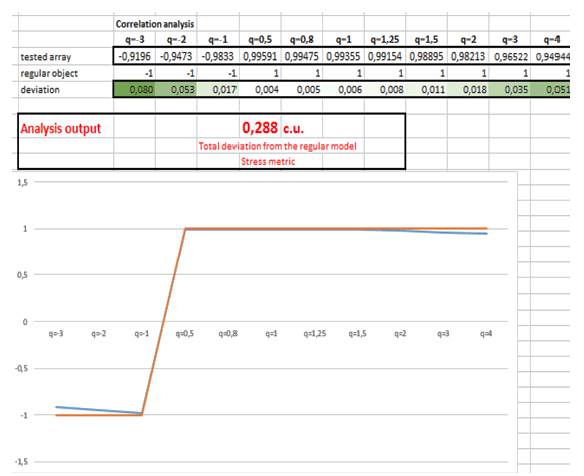
Matrix calculator and statistics estimator should not be used to add any more data as they already contain all the formulas needed to automate fractal analysis per the original method. Fig. 4 shows the output, which displays the calculation results as numbers and graphs (Gelashvili et al. 2013; Ivanov et. al. 2019).

Figure 4: Output.
According to the results of the correlation analysis, the array of individual plant data can be distributed into one of 3 categories (Fig. 4):
1. No significant correlation between the log N and log Mq indicators in the entire “q” range is observed: the object is completely devoid of self-similarity, the similarity between the properties of individual elements is absent, therefore, it is an object of a chaotic nature. During our study, this category was not detected.
2. A significant correlation between the log N and log Mq indicators in the entire “q” range is observed: the data array has self-similarity properties, in general. At the same time, a similarity between the indicators of individual plants is observed, which is impossible to detect by using standard analysis of correlations between individual indicators. This picture is the most typical for plants in our studies;
A 100% correlation between the log N and log Mq indicators in the entire “q” range is observed at the function level and the correlation factor can take three values “-1”, “0”, and “+1”: the data array uniquely has self-similarity properties, and all individual objects are completely identical to each other (Fig. 4). In this category, we included plants of Western Siberia that live in extreme environmental conditions.
The irregularity of the tested specimen-specific data arrays is measured by the total deviation of the obtained significant correlation coefficients from the coefficients typical of the regular reference object.
It is reasonable to believe that as the habitat conditions deteriorate, a group of individual plants will show the properties of a regular object more and more, i.e., an object consisting of elements completely similar to each other.
As a result, the main purpose of the fractal analysis method is to compare the real picture of the indicators of the studied plants with the indicators of a regular object, which are calculated in parallel based on the same experimental data. It implies obtaining the correlation factors between the log N and log Mq indicators for real plants and comparison of these data with the indicators of a regular object, which is essentially a comparison standard. The difference between the indicators of a real and a regular object generated by the program is estimated by the total sum of the deviation indicators of the correlation factors between real and knowingly regular objects and expressed in conditional units (Fig. 4).
Conclusion
The proposed fractal analysis program for the assessment of stress in plants has the following strengths:
1. The researcher does not need to calculate manually, as all the formulas are already there.
2. The method is universal. Calculations can use any specimen-specific indicators, whether they are regularly observed or take several seasons to collect, which is especially relevant in research of perennials.
3. The minimum dataset is small: 10*10 (10 specimens x 10 indicators). The entire system can be rebuilt to any data array size.
4. The program is fully compatible with Excel.
Acknowledgments
The work was supported by a grant from the Russian Foundation for Basic Research (RFBR) 18-44-860006 r_a.
References
Aleksandrova V.V., Ivanov V.B., Vojtova V.A. (2020). Analysis of the correlation between the results of toxicological experiments and the pH level of water. Siberian J Life Sci Agriculture 12: 71-78. https://doi. org/10.2307/2399915
Bever J.D., Dickie I.A., Facelli E., Facelli J.M., Klironomos J., Moora M., Zobel M. (2010). Rooting theories of plant community ecology in microbial interactions. Trends Ecol Evol 25: 468-478. https://doi. org/10.1016/j.tree.2010.05.004
Bundy J.G., Davey M.P., Viant M.R. (2009). Environmental metabolomics: a critical review and future perspectives. Metabolomics 5: 3-21. https://link.springer.com/article/10.1007/s11306-008-0152-0
Gaston K.J., Chown S.L. (2005). Neutrality and the niche. Functional Ecol 19: 1-6. http://userwww.sfsu.edu/parker/bio840/pdfs/neutral/ GastonChown05.pdf
Gelashvili D.B., Iudin D.I., Rozenberg G.S., Yakimov V.N., Solntsev L.A. (2013). Fractals and multifractals in bioecology. Nizhniy Novgorod 370.
Ivanov V.B., Alexandrova V.V., Usmanov I.Y., Yumagulova E.R., Chibrikov O.V., Ivanov N.A., Shcherbakov A.V. (2016). Comparative evaluation of migrating anthropogenic impurities in ecosystems of the middle Ob region through bioindication and chemical analysis. Vegetos 29: 43-46. https://doi.org/10.5958/2229-4473.2016.00018.5
Ivanov V.B., Shcherbakov A.V., Conhar I.G., Ivanova A.V., Usmanov I.Y. (2019). Using the principles of fractal analysis for description of plant flavonids metabolism. Internat J Advan Biotechnol Res 10: 456-464.
Ivanov Vyacheslav, Shcherbakov Arkadiy, Usmanov Iskander (2021). Bifurcations and neutrality in the biosynthesis of plant flavonoids. M Phytomorphol 15: 48-50. https://doi.org/10.5281/zenodo.5078363
Ivanov Vyacheslav, Shcherbakov Arkadiy (2021). Enzymes of flavonoid biosynthesis as a reason for the polyvariant nature of their accumulation. M Phytomorphol 15: 56-61. https://www.phytomorphology. com/articles/enzymes-of-flavonoid-biosynthesis-as-a-reason-for-thepolyvariant- nature-of-their-accumulation.pdf
Ivanov V.B., Dolgich А.М., Loginov А.М., Ivanovа L.G. (2018). The problem of hydrocarbon production and reclamation of oil-contaminated lands in the Khanty-Mansiysk Autonomous Okrug-Yugra. In World Scientific Discovery 10: 28-36.
Kimura M. (1983). The neutral theory of molecular evolution. Cambridge Univ Press.
Lambers H., Chapin III F.S., Pons T.L. (2008). Plant physiological ecology. Springer Sci pp: 605.
Mandelbrot B.B., Mandelbrot B.B. (1982). The fractal geometry of nature (Vol. 1). New York: WH freeman pp: 2-14. https://users.math.yale. edu/~bbm3/web_pdfs/encyclopediaBritannica.pdf
Mavletova-Chistyakova M.V., Shcherbakov A.V., Ivanov V.B., Yumagulova E.R., Usmanov I.Yu. (2017). Pulsating mosaicity of soil parameters in the Southern Trans-Urals. Bulletin of Nizhnevartovsk State Univ 4: 124-133.
McGill B.J. (2010). Towards a unification of unified theories of biodiversity. Ecol Lett 13: 627-642. https://onlinelibrary.wiley.com/doi/ epdf/10.1111/j.1461-0248.2010.01449.x
Rosenberg G.S. (2013). Introduction to theoretical ecology. In two volumes; 2nd ed., revised and expanded. Togliatti: Cassandra 1: 565; 2: 445.
Rosenberg G.S. (1984). Models in phytocenology. Мoscow USSR: Publishing House Nauka 240.
Tilman D. (2004). Niche tradeoffs, neutrality, and community structure: a stochastic theory of resource competition, invasion, and community assembly. Proceedings Nation Acad Sci 101: 10854-10861. https://doi.org/10.1073/pnas.0403458101
Hubbell S.P. (2011). The unified neutral theory of biodiversity and biogeography (MPB-32). Princeton Univ Press.
Hubbell S.P. (2006). Neutral theory and the evolution of ecological equivalence. Ecol 87: 1387-1398. https://doi.org/10.1890/0012- 9658(2006)87[1387:NTATEO]2.0.CO;2
Scherbakov A.V., Ivanov V.B., Ivanova A.V., Usmanov I.Y. (2021). The equifinal achievement of the total antioxidant activity of flavonoids by plants in various habitats. In IOP Conf Series: Earth Environ Sci 670: 012018. https://iopscience.iop.org/article/10.1088/1755-1315/670/1/012018/ pdf
Usmanov I.Yu., Scherbakov A.V., Mavletova M.V., Yumagulova E.R., Ivanov V.B., Aleksandrova V.V. (2016). A pulsating multidimensional ecological niche of plants: an extension of this concept. In: Izvestia Samara Scient Center Russ Acad Sci 18: 525-529.
Usmanov I.Y., Yumagulova E.R., Ovechkina E.S., Ivanov V.B., Aleksandrova V.V., Ivanov N.A., Shcherbakov A.B. (2016). Fractal analysis of morpho-physiological parameters of Oxycoccus palustris Pers in oligotrophic swamps of Western Siberia. Vegetos: An Internat J Plant Res 29: 1-3. https://doi.org/10.5958/2229-4473.2016.00002.1
Usmanov I.Y.U., Yumagulova E.R., Scherbakov A.V., Ivanov V.B., Aleksandrova V.V., Ivanov N.A., Mavletova-Chistuakova M.V. (2017). Physiological barriers for adventitious species invasion in oligotroph ecosystems of the Middle Ob area. Vegetos 30: 81-85. https://doi. org/10.5958/2229-4473.2017.00195.1
Yusufovich U.I., Ramilevna Y.E., Viktorovna A.V., Petrovich I.S., Vladimirovich S.A., Gennadievich G.I., Borisovich I.V. (2019). Fractal analysis of flavonoids in complex chemical compositions in extracts of Chamaedaphne calyculata (L.) Moench (Ericaceae) in oligotrophic swamps of western Siberia. M Phytomorphol 13: 35-40. https://doi. org/10.5281/zenodo.3518841
Isk U., Arkadiy S., Vyacheslav I., Sergey I., Ivan G. (2020). Use of fractal analysis principles when describing flavonoids variety of the south trans-urals plants. M Phytomorphol 14: 13-19.
Usmanov I.Yu., Yumagulova E.R., Aleksandrova V.V., Gonchar I.G., Shcherbakov A.V., Ivanov V.B. (2019). Complexes of flavonoids Hamaedafne Salicylate (l.) Moench. oligotrophic swamps of the Middle Ob. Bulletin of Nizhnevartovsk State Univ 2: 59-71.
Usmanov Iskander, Ivanov Vyacheslav, Shcherbakov Arkadiy (2020). System for ecological regulation of the biosynthesis of flavonoids as a strange attractor. M Phytomorphol 14: 77-84.
Usmanov I.Yu., Scherbakov A.V., Ivanov V.B., Ivanova A.V. (2021). Fractal Nature of Multidimensional Ecological Niche: Real Habitats in South Trans-Urals. In S.G. Maximova, R.I. Raikin, M.M. Silantyeva, & A.A. Chibilyov (Eds.), Advances in Natural, Human-Made, and Coupled Human-Natural Systems. Springer.
Usmanov I.Yu. (1986). Ecological and physiological characteristics of some plant species with different types of strategies from communities exposed to anthropogenic impact. Biol Sci 10: 66-70.
Usmanov I.Y., Ivanov V.B., Abdrakhimova G.S., Shcherbakov A.V., Yumagulova E.R., Aleksandrova V.V. (2019). Fractal analysis of flavonoids in composition HPLC-Fingerprint extracts of oxycoccus palustris pers.(ericaceae) in oligotrophic samps of Western Siberia. Internat J Adv Biotechnol Res 10: 369-376.
Usmanov I.Yu., Ivanov V.B., Ivanov N.A. (2018). Self-healing of ecosystems of the Middle Ob region under anthropogenic impacts of the oil-producing complex. In sb.: Ecological problems of large river basins-6. Proceedings Internat Conf Togliatti: Anna 303-305.
Usmanov I.Yu., Shcherbakov A.V., Ivanov V.B., Yumagulova E.R. (2019). Fractal analysis of the flavonoid biosynthesis system. Ying book: IHS “Rides of the Society of Plant Physiologists of Russia «Plant physiology is the basis for creating the plants of the future». Kazan: Kazan University Publishing House 446.